


The presence of global health and healthcare disparities results from insufficient resource investments that hinder the care of patients. Although the causes of these disparities may be complex and unique to each instance, the generation of low-cost clinical workflows would contribute to closing the health care gaps between the developed and underdeveloped world. Advances in statistical modelling and machine learning approaches, which can be deployed locally using open source programming languages, represent a unique opportunity to improve workflows and lower health care costs. A specific benefit of machine learning is the capacity to understand high dimensionality data and to generate predictions that aid in clinical decision-making. Specifically, the generation of predictive algorithms from large clinical trials, most of which would be both impractical and unfeasible to perform in developing countries, represents a unique opportunity to lower health care costs and thereby reduce global healthcare disparities.
In modern medicine, integrating patient biomarkers with clinical history permits accurate clinical decision-making. Biomarkers are not limited to the chemical detection of metabolites. The Food and Drug Administratoin (FDA)- National Institutes of Health (NIH) Biomarker Working Group definition includes any data that is an indicator of a normal biological process, a pathogenic process, or biological response to normal and pathogenic processes. Thus, biomarkers may include a diverse set of data elements, including molecular, histological, radiological, and physiological data points.1 An area that has generated significant excitement is what we refer to as "in silico biomarkers", that is, numerical outputs predictive of morbidity derived from machine learning/artificial intelligence algorithms obtained from low-cost clinical data. Low-cost biomarkers can be applied in various settings and situations as a powerful way to assess the progression of a disease or predict a health outcome. For instance, low-cost anthropometric measurements, including body mass index (BMI), waist circumference (WC), and waist-to-hip ratio (WHR) have shown a significant predictive capacity for adverse health outcomes in adult patients. Anthropometric measurements are non-invasive, inexpensive, and easily deployed in clinical practice. These measurements could offer a solution to lowering healthcare costs and improving access to healthcare in underserved medical communities. The comparison between high-income and low and middle-income countries exposes a large survival gap between babies born in these locations. There continues to be a lack of effective interventions to reduce death and disability in premature babies. Specifically, this care has not yet reached the poor and most disadvantaged populations where the burden is highest.2 However, implementation of these points in premature babies is more challenging due to the high variance of birth weights recorded across centers. Furthermore, investment in large, multi-center clinical trials represents a significant capital expenditure well beyond the budgets of most global healthcare ecosystems. The question therefore remains, what can one learn from clinical trials done in wealthy countries, and are those conclusions generalizable to other healthcare ecosystems?
To address these issues, we analyzed the Prematurity and Respiratory Outcomes Program (PROP) datasets, which are available upon request from Biolincc repository at the U.S. National Heart Lung and Blood Disease. In May 2010, the National Institutes of Health (NIH) and the National Heart, Lung, and Blood Institute (NHLBI) funded a 5-year $18.5 million research initiative to ultimately improve strategies for managing the respiratory complications of preterm and low birth weight infants. This clinical study was a multicenter, prospective study enrolled from 2011 to 2014, conducted under institutional review board approval (ClinicalTrials.gov: NCT01435187). The PROP clinical trial sought out to understand factors that can predict the future risk for respiratory morbidity in premature infants born <30 weeks gestation.3 The study designers focused on identifying clinical, physiologic, or biochemical biomarkers during the NICU hospitalization that could predict respiratory morbidity through 1 year of age. Although fraught with incomplete/missing data elements, the PROP dataset contains a significant quantity of unmined data potential upon which low-cost predictive models can be generated. In this manuscript, we evaluated the PROP data to identify the strongest predictors of morbidity. Analysis of this dataset indicated that anthropomorphic metrics, including gestational age, weight and head circumference were the most highly associated with morbidity. We thus generated a predictive model of patient weight evolution and propose that this method is more useful for the evaluation of patient trajectory in premature infants when compared to mere percentile-based systems. We found that although this approach carries some promise in generating “in silico biomarkers” based on machine learning tools, these are not fully generalizable to other healthcare ecosystems and posit that local informatics investments are required to generate in silico biomarkers.
METHODS
Clinical datasets (PROP datasets)
The PROP was an observational prospective cohort study performed by a partnership of six clinical centres (incorporating tertiary neonatal intensive care units [NICU] at 13 sites) and a data-coordinating centre working in collaboration with the NHLBI. These study centres included: Vanderbilt University, University of California San Francisco, University of Rochester and University at Buffalo, Washington University, Cincinnati Children’s Hospital Medical Center, Indiana University, and Duke University. Participants were between the gestational ages of 23 0/7 to 28 6/7 weeks (Pryhuber et al., 2015). Data was requested from the Biolincc repository and downloaded as SAS files. These files were then imported into Rstudio. Uruguay dataset: A validation set for prematurity was obtained from the Informatic Perinatal System in Uruguay (CLAP/OPS (https://www.paho.org/es/documentos/sistema-informatico-perinatal-uruguay-sip-2000), the perinatal database used all over the country both as the individual institutional registry system and the national health ministry system. For this analysis, the data were obtained from newborns between 23 and lower than 30 weeks of gestational age, born in the Hospital de Clínicas maternity from the Faculty of Medicine, Udelar, Montevideo, Uruguay.
Data analysis
All data analysis was performed in R studio. All codes are presented in the Online Supplementary Document. Primary data is available from the Biolincc repository at the NHLBI. To generate an individualized projection of patient weight gain for premature infants by using the PROP trial data, we created two support vector regression models. We split 70% of the PROP patients into a training set, and 30% into a test set. We then used the tune.svm function of the caret package. This workflow performs a 10-fold cross-validation to identify the optimal hyperparameters for the support vector regression. To evaluate head circumference (HC), we modelled the daily head circumference as a function of post-menstrual age, birth weight, sex, and birth head circumference. The best performing HC-svm regression model showed an RMSE of 1.47 and 1.49 on the training set and test set, respectively, and an MAE of 1.04 and 1.03 on the training set and test set, respectively. Using the same training/test split, we generated a support vector regression model to predict patient weight gain. To predict the patient’s daily weight, we modelled weight as a function of post-menstrual age in weeks, birth head circumference, birth weight, sex, and the recorded head circumference. For the weight-svm regression, the model showed an RMSE of 204.7 and 215.16 on the training set and test set, respectively, and an MAE of 142.79 and 148.4 on the training set and test set, respectively. As the measures of fit (RMSE and MAE) are similar in the train set and test sets, we conclude that our model has not overfit to the PROP training set data. We further conclude that although this modeling may be useful as a benchmark, the quantity of error obtained is unsuitable for precise weight predictions, especially at older age groups.
RESULTS
Cluster analysis of PROP datasets identifies two main clusters differentiated based on anthropometric measurements
We note that the PROP dataset contains information of 835 enrolled patients obtained over 6 centers in the United States of America. Upon PROP database evaluation, one reveals significant analytical challenges, including vast complexity in data types, with an abundance of missing values present for each patient. Within this dataset, we found the following features to be present in 813 of the enrolled patients: patient birth weight (numeric class), patient gestational age at birth (numeric class), patient head circumference at birth (numeric class), and Apgar scores at 1 and 5 minutes (ordinal scale coded as factor class), in addition to the following features present as dummy variables of boolean values (0 = negative, 1 = positive) that we converted to factor class in R: presumed sepsis, culture proven sepsis, retinopathy of prematurity, patent ductus arteriosus, presence of pulmonary hypertension, clinical chorioamnionitis diagnosis, pulmonary hemorrhage, and maternal diabetes. Including more features of NICU outcome resulted in significant decrease in patients with complete data, and so we opted to keep these features without utilizing any imputation techniques. We converted the ordinal scale and boolean values to dummy variables, and performed a principal component analysis (PCA) of the data (Figure 1, panel A). To visualize the features, we plotted the eigenvectors in PC’s 1 and 2, and noted that the associations between variables followed well-established correlations reported in the neonatology literature. For instance, a diagnosis of ROP is inversely correlated to patient birth weight. From the principal components, we obtained the PC’s accounting for up to 90% of the data variance, and tested the optimal number of kmeans clusters using the silhouette method. This analysis indicated that within the PROP dataset, the optimal number of patient clusters using these features was k=2 clusters (Figure 1, panel B). We split the datasets into these two clusters with the kmeans algorithm, calculated the cluster statistics Dunn2, average distance between clusters, and average distance within clusters using the cluster.stats() function call from R’s fpc package (Figure 1, panel C, statistical significance determined by permutation analysis). To determine which features were the principal drivers of clustering, we generated a random forest model to predict the patient class designation (determined by the kmeans clustering algorithm), to the aforementioned features. Figure 1, panel D shows the importance of each feature from the random forest algorithm. Note that the three main features in clustering were the morphometric and clinical features (i) gestational age at birth, (ii) birth weight, and (iii) head circumference. To further evaluate these clusters, we visualized the patients by plotting each patient in PC1 and PC2, color coded by cluster, shown in Figure 2. We noted that overall, cluster 1 was characterized by patients with higher birth weights, higher birth head circumference, and higher gestational age (Figure 2, panels A1-C2), and that these patients had fewer episodes of presumed sepsis, as well as fewer comorbidities (Table 1 lists the odds ratio of comorbidities associated in comparing cluster 1 patients to cluster 2 patients). We conclude that the morphometric features of birth weight, birth gestational age, and birth head circumference represent significant predictors of comorbidities during the early post-natal period.


Morphometric Features are associated with respiratory dysfunction in premature children
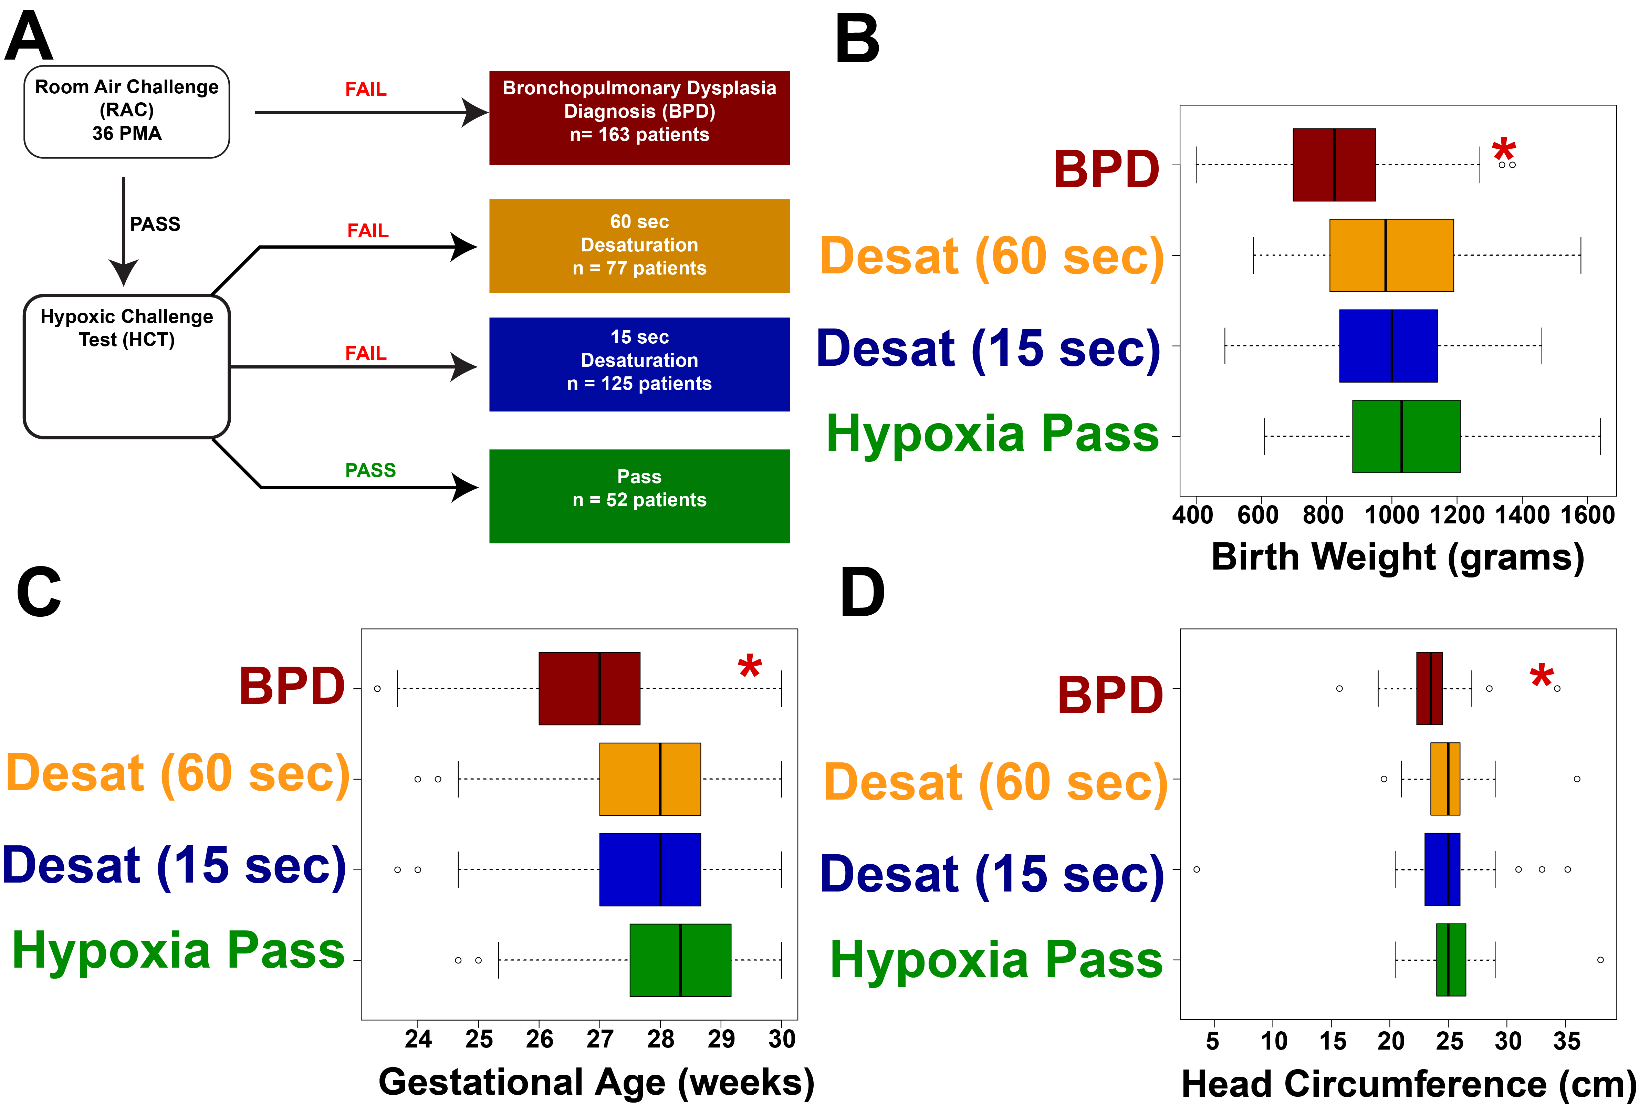
Within the PROP protocol, a subset of patients was subjected to non-invasive respiratory assessments (NIRAs), including respiratory inductance plethysmography (RIP), pulse oximetry recordings during sleep, bronchodilator response, and oxygen reduction challenges. Data regarding use of supplemental oxygen at 36 ± 1 weeks PMA was recorded in this context, and the results of a standardized oxygen requirement challenge test were collected. If patients failed a room air challenge at 36 weeks, these patients were labelled BPD-positive. For those patients who passed the room air challenge, a hypoxic challenge test (HCT) was performed. Of these patients, those without desaturation were deemed HCT Pass. Patients who showed desaturations were split into those with short desaturations and those with longer desaturations (see Figure 3, panel A for clarification). We found that BPD positive patients showed statistically significant decreases in the aforementioned morphometric features, including birth weight, gestational age, and head circumference (Figure 3, panels B-D, P<0.001 by ANOVA in all comparisons). To further explore the relationships between morphometric features and major comorbidity indicators, we generated a statistical model whereby we modelled the probability that patients were treated for clinically apparent sepsis was predicted as a function of birthweight, head circumference, birth gestational age, weight at the 36 week test date, and respiratory rate at 36 weeks (i.e., the time of the testing for RAC and HCT). These data are plotted in Figure 4. Note that the BPD patients and those with a prolonged desaturation of over 65 seconds in the hypoxia challenge test showed, for a given birth weight, birth head circumference, birth gestational age, and weight at testing, an elevated probability of sepsis. In all groups, decreasing these morphometric features resulted in a linear increase in the probability of presumed sepsis. We note that of all of the morphometric features, the patient’s weight at 36 weeks (i.e., the patient’s weight at testing), showed the largest negative slope (note the negative slope in Figure 4, panel D relative to Figure 4, panels A, B, and C). We also note the novel finding that patients without BPD but with worsened oxygen desaturations are associated with increased sepsis, indicating potentially that RAC testing alone may not identify all patients with respiratory dysfunction. We conclude that basic clinical and anthropomorphic features correlate with poor outcomes in PROP trial patients.


Generation of a growth prediction model based on PROP patient data.
Given that the morphometric features were primarily associated with high morbidity outcomes, we evaluated the growth trajectory of all PROP patients by plotting the growth curves obtained from the daily weights as well as the head circumferences obtained during the hospitalization. Daily weights and frequent head circumferences were obtained for the patients, which we plotted in Figure 5. We noted overall a trend to a sigmoidal growth curve in patient weight in the PROP patients as described previously. However, nearly half of all PROP patients grew below the 10th percentile of the Fenton curve (Figure 5, panel A), raising the potential that Fenton curves may have diminishing value in patients born at this gestation. Head circumference overall showed a relatively linear increase over postnatal development (Figure 5, panel B). We therefore sought to determine if we would be able to generate an individualized projection of patient weight gain for premature infants by using the PROP trial data (see Materials and Methods). To generate our growth projection, we utilize these regression models by first generating a projection of the HC growth during hospitalization (the steps of this workflow are outlined in Figure 6, panel A). As the HC svm takes data available at birth (post-menstrual age, birth weight, sex, and birth head circumference), we can generate a vector of predicted HC’s from birth to 40 weeks gestation. This HC-svm regression model generates our predicted HC, which we then plug into the growth prediction svm regression model to generate a curve. We tested the hypothesis that patients who showed better actual growth relative to predicted growth had lower probabilities of comorbidities relative to patients who showed worse actual growth relative to predicted growth in PROP patients. These data are shown in Table 2, with example projections from PROP patients with and without culture-proven sepsis shown in Figure 6, panels B-D. We note that culture-proven sepsis was much more probable in patients underperforming their predicted growth curve of PROP patients (Table 2) These data raise the potential of utilizing deviation of actual weight to these individualized growth curves as a metric for morbidity, and therefore meet the criteria for an in silico biomarker.


PROP-trained models do not generalize to other health care ecosystems.
To validate these data, we obtained growth curves from the Hospital de Clínicas, Montevideo, Uruguay of 44 patients born less than 30 weeks gestational age. We then evaluated the extent to which the patients overperformed their weights or underperformed their actual weights relative to our model prediction. Figure 6, panels E-I shows growth curves of the 5 decedents with complete data. We note that in these instances of decedents, significant underperformance of our growth prediction occurred using data trained on the PROP dataset, and that in three of the decedents their weights were above the 10th percentile Fenton curve line. We conclude that at early ages, negative deviation from the PROP-based projected line may be a strong indicator of poor outcome.
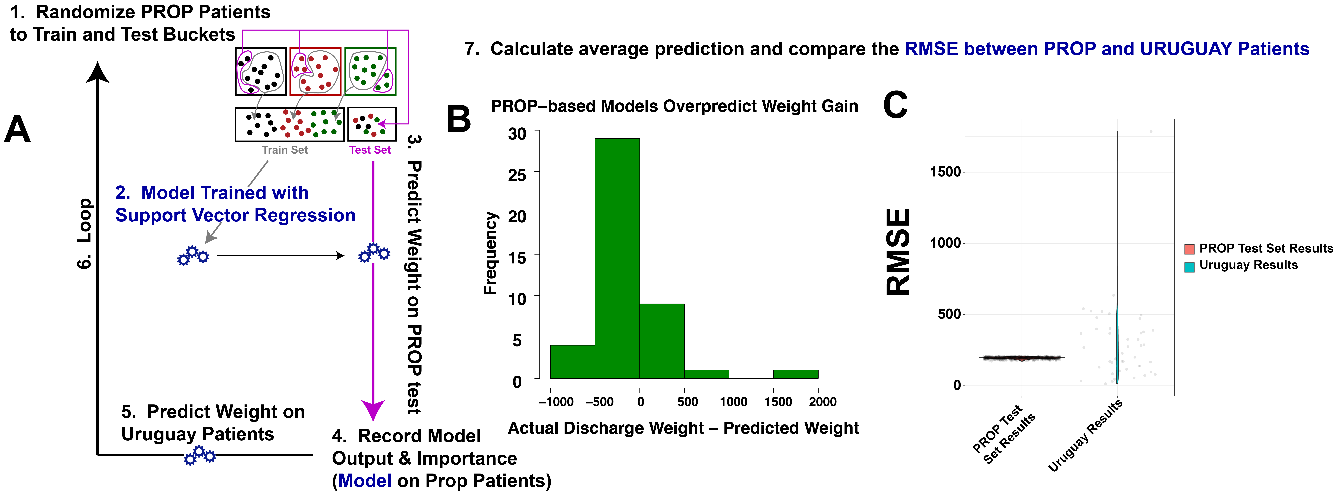
We next tested the extent to which the PROP-based models could predict long-term weight. To achieve this, we generated multiple permutations of PROP train/test sets, and then obtained the RMSE for each test set prediction. These were compared in each model’s iteration to the RMSE of the available patient weight data of the Uruguay patients (see Figure 7, panel A for workflow). This iterative loop permitted concurrent evaluation of PROP test-set predictions and Uruguay validation predictions. We note that the PROP-based models nearly consistently overestimated patient weights in the Uruguay population (Figure 7, panel B). Furthermore, the RMSE of the PROP test sets were extraordinarily narrow relative to the Uruguay validation set (Figure 7, panel C). We conclude that the models generated show consistent errors on patients obtained from PROP-like ecosystems, whereas patients from different ecosystems show worsened fit. We further conclude that deploying a clinical prediction model trained on PROP patient data is not deployable in other Healthcare settings.

DISCUSSION
Prematurity is a major health problem causing severe morbidity and mortality among newborns. The majority of comorbidities associated with prematurity are respiratory illnesses which need to be promptly identified and treated. The current use of laboratory biomarkers to detect these comorbidities is time-consuming and has incremental cost effects. There is a clear variation in the detection and management of comorbidities among developed and underdeveloped countries. Even though the path to generalize treatment protocols across various countries to bridge the gap has been underway, the capital expenditures needed to modernize infrastructure to follow clinical guidelines often lead to inaction, ultimately expanding health care inequity. With the advancement in technologies, the development of simple yet cost-effective techniques to monitor health can now be established.
In this study, we performed a secondary analysis of the PROP clinical trial dataset and identified the strength of the predictive potential of in silico biomarkers based on anthropomorphic measurements. Anthropometric measurements are easy to obtain and do not require major infrastructure or excessive training. Hence, its utility in generating in silico biomarkers may provide a cost-effective solution in predicting diseases associated with prematurity. The use of anthropometry in predicting comorbidities has also been previously established in research. For example, Gidi et al4 reported that foot length (FL), chest circumference (CHC) and mid-upper arm circumference (MUAC) taken on day 1 and 5 after birth could be used as diagnostic tools for LBW or prematurity. Another study indicated that very low body weight is a risk factor for developing strabismus.5 Similar study showcases the protective effect of weight gain on the development of Retinopathy Of Prematurity.6 We further identified in our study an intriguing relationship between weight, probability of sepsis, and respiratory dysfunction. Specifically, we identified that for a given weight, head circumference, and gestational age, the probability of sepsis increased drastically in patients with BPD and non-BPD patients with major desaturations during hypoxic challenge. This is in line with the existing literature that shows an increasing association of BPD with neonatal sepsis.7,8 We then an in silico biomarker based on anthropomorphic measurement projections derived from support vector regression, and found that there was an increase in sepsis probability in patients underperforming our growth projection model. Although we found a promising implementation of this model in the identification of fatalities in the Uruguayan dataset, the PROP-trained support vector regression model showed poor generalizability to the Uruguayan validation set. In summary, although general trends extracted from the PROP trial may be generalizable to other health care ecosystems, utilization of clinical trials with strict inclusion/exclusion criteria to generate in silico biomarkers may not be feasible.
Given the unique clinical practice paradigms practiced in each health care ecosystem, we posit that many of these challenges in generalizability between centers in different countries will persist as we deploy models built and trained upon patient data that are different from local ecosystems. The reasons for this lack of generalizability are numerous, but may include different caloric supplementation protocols between Uruguay and the United States, different incidence of disease, different maternal factors, etc. This finding has significant implications for global health paradigms. Specifically, it raises the need for local hospitals to invest in strong clinical informatics programs, where locally relevant in-silico biomarkers can be developed using local data relevant to the local population. For instance, the diagnoses of BPD were rendered based on interpretation of distinct datapoints between PROP patients and the Uruguayan patients. Hence it is imperative that proper bioinformatics program be established in local healthcare ecosystems to account for these differences. Important information can be extracted by reanalyzing existing data using advancements such as machine learning. Efforts should be made to promote the digitization of patient records and the interpretation of those datasets in local health care systems. We note that in the absence of strong IT infrastructure, resource-strained health care ecosystems may consider creative implementations of decentralized applications, or dApps, run on proof-of-stake blockchain technologies. These technologies offer privacy, and many examples of dApps with machine learning and artificial intelligence components are reaching the markets now. With such a system, a patient record could undergo tokenization in a blockchain and be evaluated using autonomous AI engines. This would create a secure, private network for which large-scale health data analytics could be deployed.
Acknowledgements
None.
Funding
None.
Authorship contributions
All authors contributed equally.
Competing interests
The authors completed the Unified Competing Interest form at http://www.icmje.org/disclosure-of-interest/ (available upon request from the corresponding author), and declare no conflicts of interest.
Correspondence to:
José Javier Otero, M.D., Ph.D.
Director of Neuropathology
Associate Professor
The Ohio State University College of Medicine
Department of Pathology
333 W 9th Avenue
Columbus, OH 43017
[email protected]
Fernanda Blasina, M.D., M.Sc, Ph.D.
Director of Neonatology
Professor
University Hospital, Faculty of Medicine
Avda Italia s/n CP 11600
Montevideo, Uruguay
[email protected]