Visceral leishmaniasis (VL; also known as kala-azar) is a neglected tropical disease that is typically fatal if left untreated. Globally there are an estimated 300,000 cases and over 20,000 deaths each year, with over 616 million people thought to live endemic areas at risk of VL infection.1
Two species of Leishmania are known to cause VL. The protozoa are transmitted by sand flies, and in East Africa, the Yemen and the Indian subcontinent VL is caused by anthroponotic transmission of L. donovani, while zoonotic transmission of L. infantum causes cases in South America, Southwest Asia and in the Mediterranean climates of Europe and North Africa. Both forms have also been reported in China. It is typically the poorest in these regions that are most at risk, and climate change may increase the at-risk population.2
A diagnosis can be confirmed by culture-based, serological or molecular assays,3 and treatment options vary by disease type and region. Pentavalent antimonial (Sb(V)) monotherapy was the mainstay of treatment for many years, however its side effect profile and increases in the rate of treatment failure led to its replacement as a first-line treatment option.4,5 There are two forms of Sb(V): sodium stibogluconate (SSG) and meglumine antimoniate (MA), also known as Pentostam and Glucantime respectively. Historically, cases in East Africa and the Indian subcontinent were mainly treated with SSG, while cases in South America, Europe and North Africa were mainly treated with MA.
The WHO currently recommends Sb(V) monotherapy at 20mg/kg/day intramuscularly or intravenously for 30 days as a second-line treatment option for L. donovani cases in East Africa and the Yemen. The same dosage for 28 days is also recommended as a second-line therapy for L. infantum cases in Europe, the Middle East, Central Asia and South America. High rates of treatment failure in the Indian subcontinent mean that Sb(V) is no longer deemed efficacious in certain regions (eg, Bihar, India) and 30 days of Sb(V) monotherapy is now the fifth-line option in areas where Sb(V) are known to remain effective.5
Successful treatment is indicated by clinical and/or parasitological cure. Complete parasite clearance is thought to be rarely achieved, and it is considered that the majority of successfully treated immunocompetent patients develop effective life-long cellular immunity.6,7 However, a proportion of immunocompetent patients relapse, typically within six months of treatment.8 Many studies therefore publish the rates of initial (end-of-treatment) and final (six-month follow-up) cure.9–11 The rate of relapse rises significantly when patients are co-infected with human immunodeficiency virus type 1 (HIV-1).8,12 Many of the reports of apparent resistance to Sb(V) come from clinical interventions where, in the absence of a molecular marker, treatment failure is used as a proxy for resistance.13–15
Although no longer a first-line option, Sb(V) monotherapy remains an important second-line option across East Africa, Europe, the Middle East, Central Asia and Latin America. The objective of this meta-analysis was therefore to provide an up-to-date summary and synthesis of the rates of Sb(V) initial and final treatment failure in human VL. Thus far, no meta-analysis of the treatment failure rate of the WHO Sb(V) regimen has been performed. This analysis is important as it fills this knowledge gap with the statistical power provided by a meta-analysis and an up-to-date appraisal of treatment failure rates will help inform policy makers in determining the order in which VL therapies are offered to patients in different parts of the world. Therefore, systematic searches of the literature were conducted and studies of any design which reported the outcomes of 10 or more primary VL patients treated with Sb(V) according to the recommended WHO regimen were identified for inclusion.
METHODS
Literature search
Systematic searches were conducted using five electronic databases: EMBASE (Ovid; 1980-2018), MEDLINE In-Process & Other Non-Indexed Citations (Ovid) and MEDLINE (Ovid; 1946-2018), Global Health (Ovid; 1973-2018), Web of Science and BIOSIS Citation Index (1926-2018). The Web of Science Core Collection Citation Indexes searched were: Science Citation Index Expanded (1900-2018), Conference Proceedings Citation Index- Science (1990-2018), Book Citation Index – Science (2005-2018) and the Emerging Sources Citation Index (2015-2018). Two complementary search strategies with no restrictions on language, study date or study design were devised. Strategy one used terms related to all forms of leishmaniasis, combined with terms for Sb(V) and terms for treatment failure. Strategy two used the same terms for Leishmania and Sb(V), combined with terms associated with clinical studies in general and studies more specifically of Sb(V) therapy for leishmaniasis. Full details of each search strategy are provided in Appendix S1 in the Online Supplementary Document. The results of both search strategies were updated during final preparation of the manuscript. Additional manuscripts were identified from review articles and manual searching.16–19 Deduplication was performed using Endnote (version X8.0.1), Zotero (version 5.0.47) and Systematic Review Accelerator [http://crebp-sra.com].20 This review was conducted in accordance with the Preferred Reporting Items for Systematic Reviews and Meta-Analyses (PRISMA) guidelines, and a PRISMA checklist completed (Appendix S2 in the Online Supplementary Document). A study protocol was not published prior to this study.
Selection of studies
The titles and abstracts of the articles were independently screened against primary inclusion criteria by two authors (CMJ, JDJ). Articles that reported the treatment of 10 or more human primary VL patients with Sb(V) were selected, with discrepancies solved by consensus (CMJ, JDJ). Studies that did not contain primary patient data, reported in vitro findings, were not available in English, in which Sb(V) was used as part of a combination therapy or the patient population was exclusively HIV-1 positive or otherwise immunocompromised were excluded. No selection criteria were applied to the publication date, geographical area, patient demographics or study design. A full-text analysis of the remaining articles was then conducted independently by two authors, with discrepancies solved by consensus (CMJ, JDJ). Selected studies reported the outcomes of patients treated with either SSG or MA according to the recommended WHO dosing regimen (20 mg/kg/day parenterally for 28–30 days) and contained data for 10 or more patients about the initial (end-of-treatment) and/or final (six-month follow-up) cure that permitted calculation of the proportion of treatment failures. Given that the efficacy of Sb(V) against VL in patients co-infected with HIV-1 has been shown to be reduced,21,22 only studies in which fewer than 5% of patients were HIV-1 positive or all HIV-1 patients could be statistically excluded were selected. Study populations for which HIV-1 prevalence was not reported were included.
Data extraction
Data from the remaining studies was independently extracted into separate spreadsheets by two authors, with discrepancies solved by consensus (CMJ, JDJ). Extracted data included study type, study years, study nation(s), form of Sb(V) used, the mean age of the patients (or median, if mean not reported) and the size of the total study population. Also extracted were the number of initial and final treatment successes and failures, number of patients that defaulted (ceased treatment of their own volition) or were withdrawn (on medical advice) during treatment, the number lost or that developed PKDL during follow-up and the number of deaths.
Key definitions
Initial treatment success was defined as clinical and/or parasitological cure after 28-30 days of Sb(V) therapy according to WHO guidelines.5 Where clinical and parasitological cure data were provided, parasitological test-of-cure was taken to be more precise. Final cure was defined as initial cure with no relapse or PKDL at six months post-treatment.
The proportion of initial failures was calculated by dividing the number of failures during the study period through the total number of patients treated, where treated is the sum of patients that were initially cured or initially failed treatment. Patients that initially failed treatment and were re-treated with Sb(V) were discounted from follow-up analyses, such that the sum of final cures, failures, PKDL patients and those lost to follow-up was equal to the number of initial cures where such data was available.
The proportion of final failures was calculated by dividing the number of final failures through the sum of the number of patients that were cured or had failed treatment at follow-up. Patients lost to follow-up were discounted.
The assumption was made that withdrawals or defaults were secondary to the toxicity of the drug and that no evaluation of treatment efficacy could be made for these patients. The mortality rate of VL was assumed to be greater than Sb(V) and therefore deaths during treatment or the follow-up period were defined and presented as initial or final treatment failures respectively.
Statistics
Random-effects meta-analyses of proportions were performed using a per protocol approach. 95% confidence intervals (CIs) were calculated for individual studies and the principal summary measure of the pooled proportions of treatment failures. Study heterogeneity was assessed by the I2 statistic, reported with 95% CIs, and interpreted as low (≤25%), moderate (25-75%) and high (≥75%).23 Statistical analyses were performed using MedCalc for Windows, version 18.0 (MedCalc Software, Ostend, Belgium).
Risk of bias
The risk of bias was assessed at the individual study level. Randomised controlled trials (RCTs) were assessed using the Cochrane risk of bias tool for randomised controlled trials.24 The risk of bias in non-randomised studies of interventions (ROBINS-I) assessment tool was used to assess bias for retrospective and cohort studies. Publication bias was assessed using funnel plots.25,26
RESULTS
Study selection and characteristics
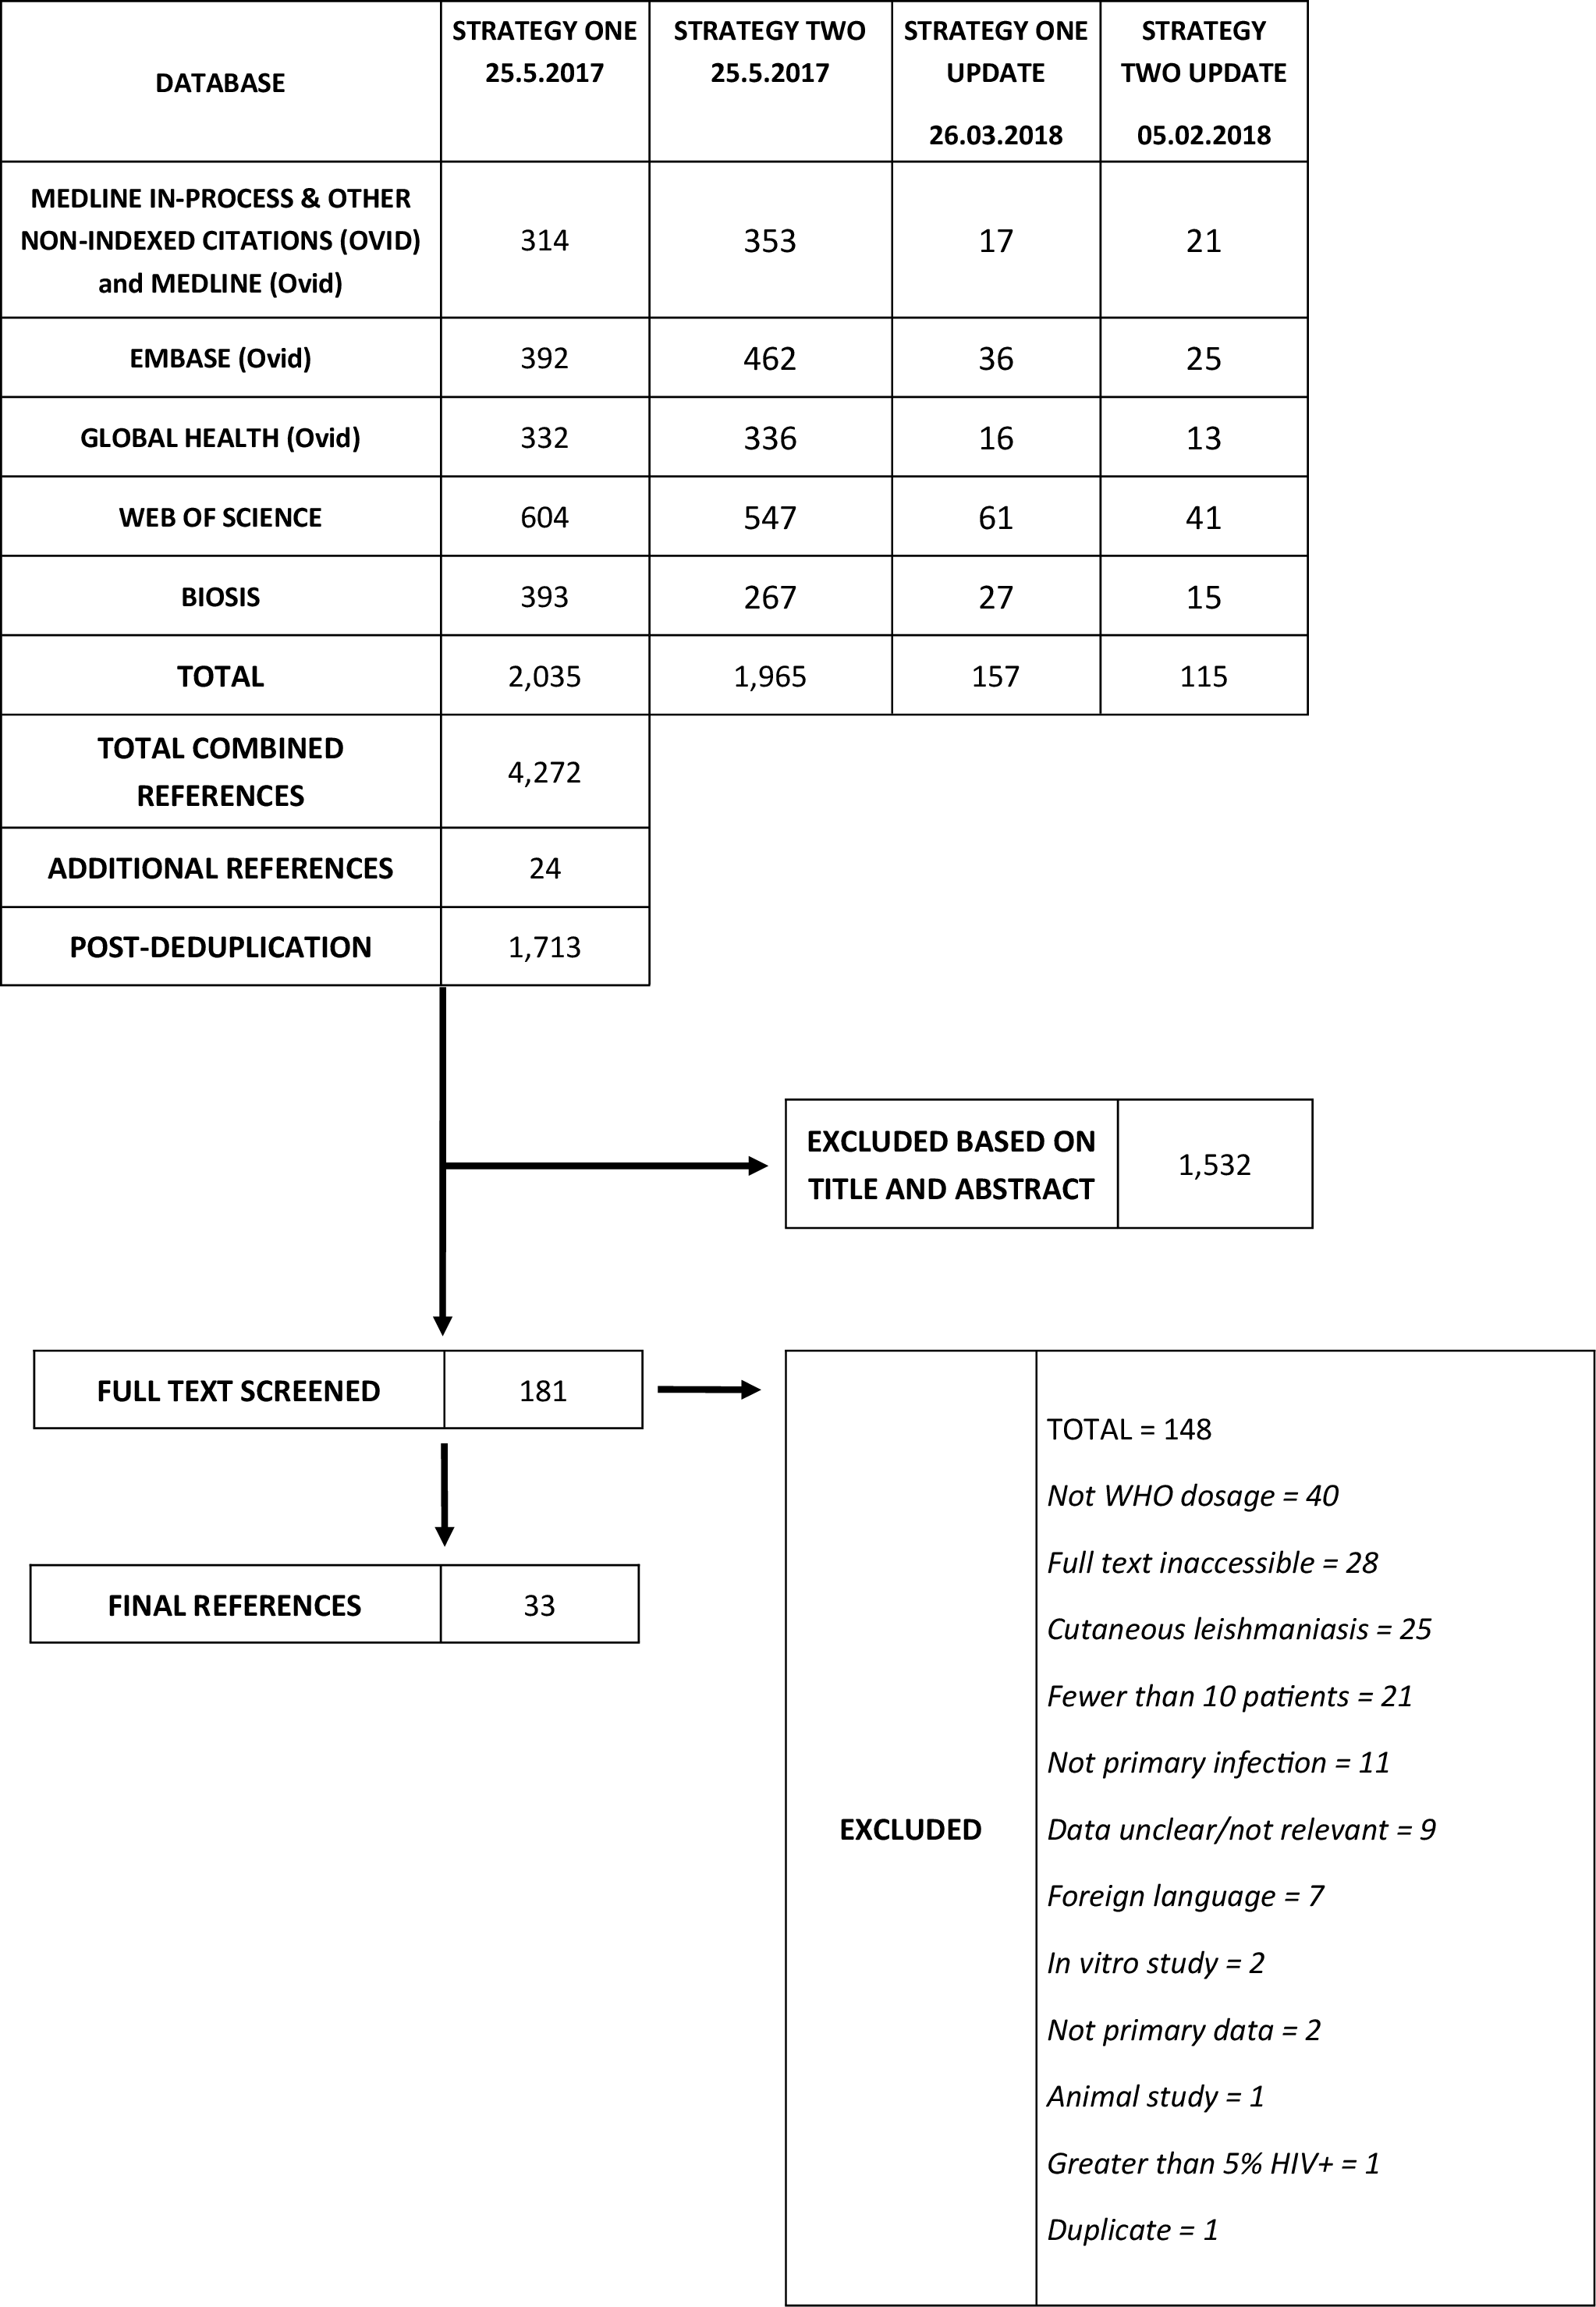
Figure 1 illustrates the five databases that were systematically searched using two distinct search strategies. These complementary search strategies were chosen to ensure that cohort and retrospective studies that investigated drug resistance were obtained together with clinical trials. A further 24 references were obtained from reviews and manual searches, and a total of 1,713 deduplicated references were screened against broad inclusion criteria, of which 1,532 were excluded. The full-texts of the remaining 181 articles were subsequently screened against refined inclusion criteria, of which 148 were excluded because: of a dose regimen that did not match the WHO regimen (n=40); the full-text was inaccessible (n=28, see Appendix S3 of the Online Supplementary Document); cutaneous, not VL, was studied (n=25); fewer than 10 patients were studied (n=21); the patient population in whole or part did not have primary VL (n=11); the data were unclear or not relevant to this study (n=9); the article was not published in English (n=7); the studies used in vitro (n=2) or animal (n=1) approaches; the articles did not contain primary data (n=2); greater than 5% of the study population was HIV-1 positive (n=1); they were found to be duplicates (n=1).

Of the 33 final articles,9,10,13–15,27–53 31 contained data regarding the initial treatment outcome (Table 1) and 16 regarding the final outcome (Table 2); 14/31 contained data for both end-of-treatment and six-month follow-up. Of the 54,826 VL patients for which data regarding initial treatment outcome was available, 45,862 (83.7%) were successfully treated, 8,865 (16.2%) failed treatment and 99 (0.2%) defaulted or were withdrawn and did not complete treatment. Of the patients that completed treatment, 93.7% (51,257) were drawn from one large study.42 Of the 1,493 VL patients for which data regarding final treatment outcome was available, 1,308 (87.6%) were successfully treated, 125 (8.4%) failed treatment, 59 (4.0%) were lost to follow-up and one (0.07%) developed PKDL.
The mean age of the 3,781 patients for which mean age data were available/calculable was 17.9 years old - excluding two studies which did not report age data and three studies which reported median age data. The median number of patients per study was 61, with a median study period of 2.0 years. The studies were conducted in India (13; n=1,068), Sudan (6; n=52,711), Ethiopia (3; n=386), Kenya (3; n=142), Nepal (3; n= 45), Uganda (1; n=161), Iran (1; n=61) and Turkey (1; n=15), with two studies conducted across Sudan, Ethiopia and Kenya (n=691). 18/33 were RCTs, 9/33 were of a cohort design and 6/33 were retrospective analyses.
All studies were assessed for risk of bias using tools from The Cochrane Collaboration.24,54 All but one of the RCTs were assessed to be of an Agency for Healthcare Research and Quality standard of fair or good (Table 3). Zijlstra and colleagues 1993 was assessed as poor due to inadequate reporting of their randomisation process and a failure to explicitly mention whether patients with a history of VL treatment were excluded from the study, however it was not excluded as there was no reason to consider this as a substantial source of bias for the purposes of this study. None of the cohort or retrospective studies were assessed as having greater than a moderate risk of bias, consistent with studies of a sound nature for non-randomised trials (Table 4).
Meta-analyses of the efficacy of Sb(V) treatment
For all meta-analyses the studies were grouped according to drug type and geographical region.
The efficacy of Sb(V) treatment at six-month follow-up
16 studies contained six-month follow-up data for patients treated with Sb(V), SSG was used in all studies; no data for MA was available.
Six-month efficacy of SSG in the Indian subcontinent
Six-month follow-up data were available for a pooled population of 797 patients across the 13 studies conducted in the Indian subcontinent, 2/13 of which contained data from Nepal and 11/13 from the neighbouring Indian states of Uttar Pradesh and/or Bihar. We therefore elected to analyse the data at both regional and national levels.
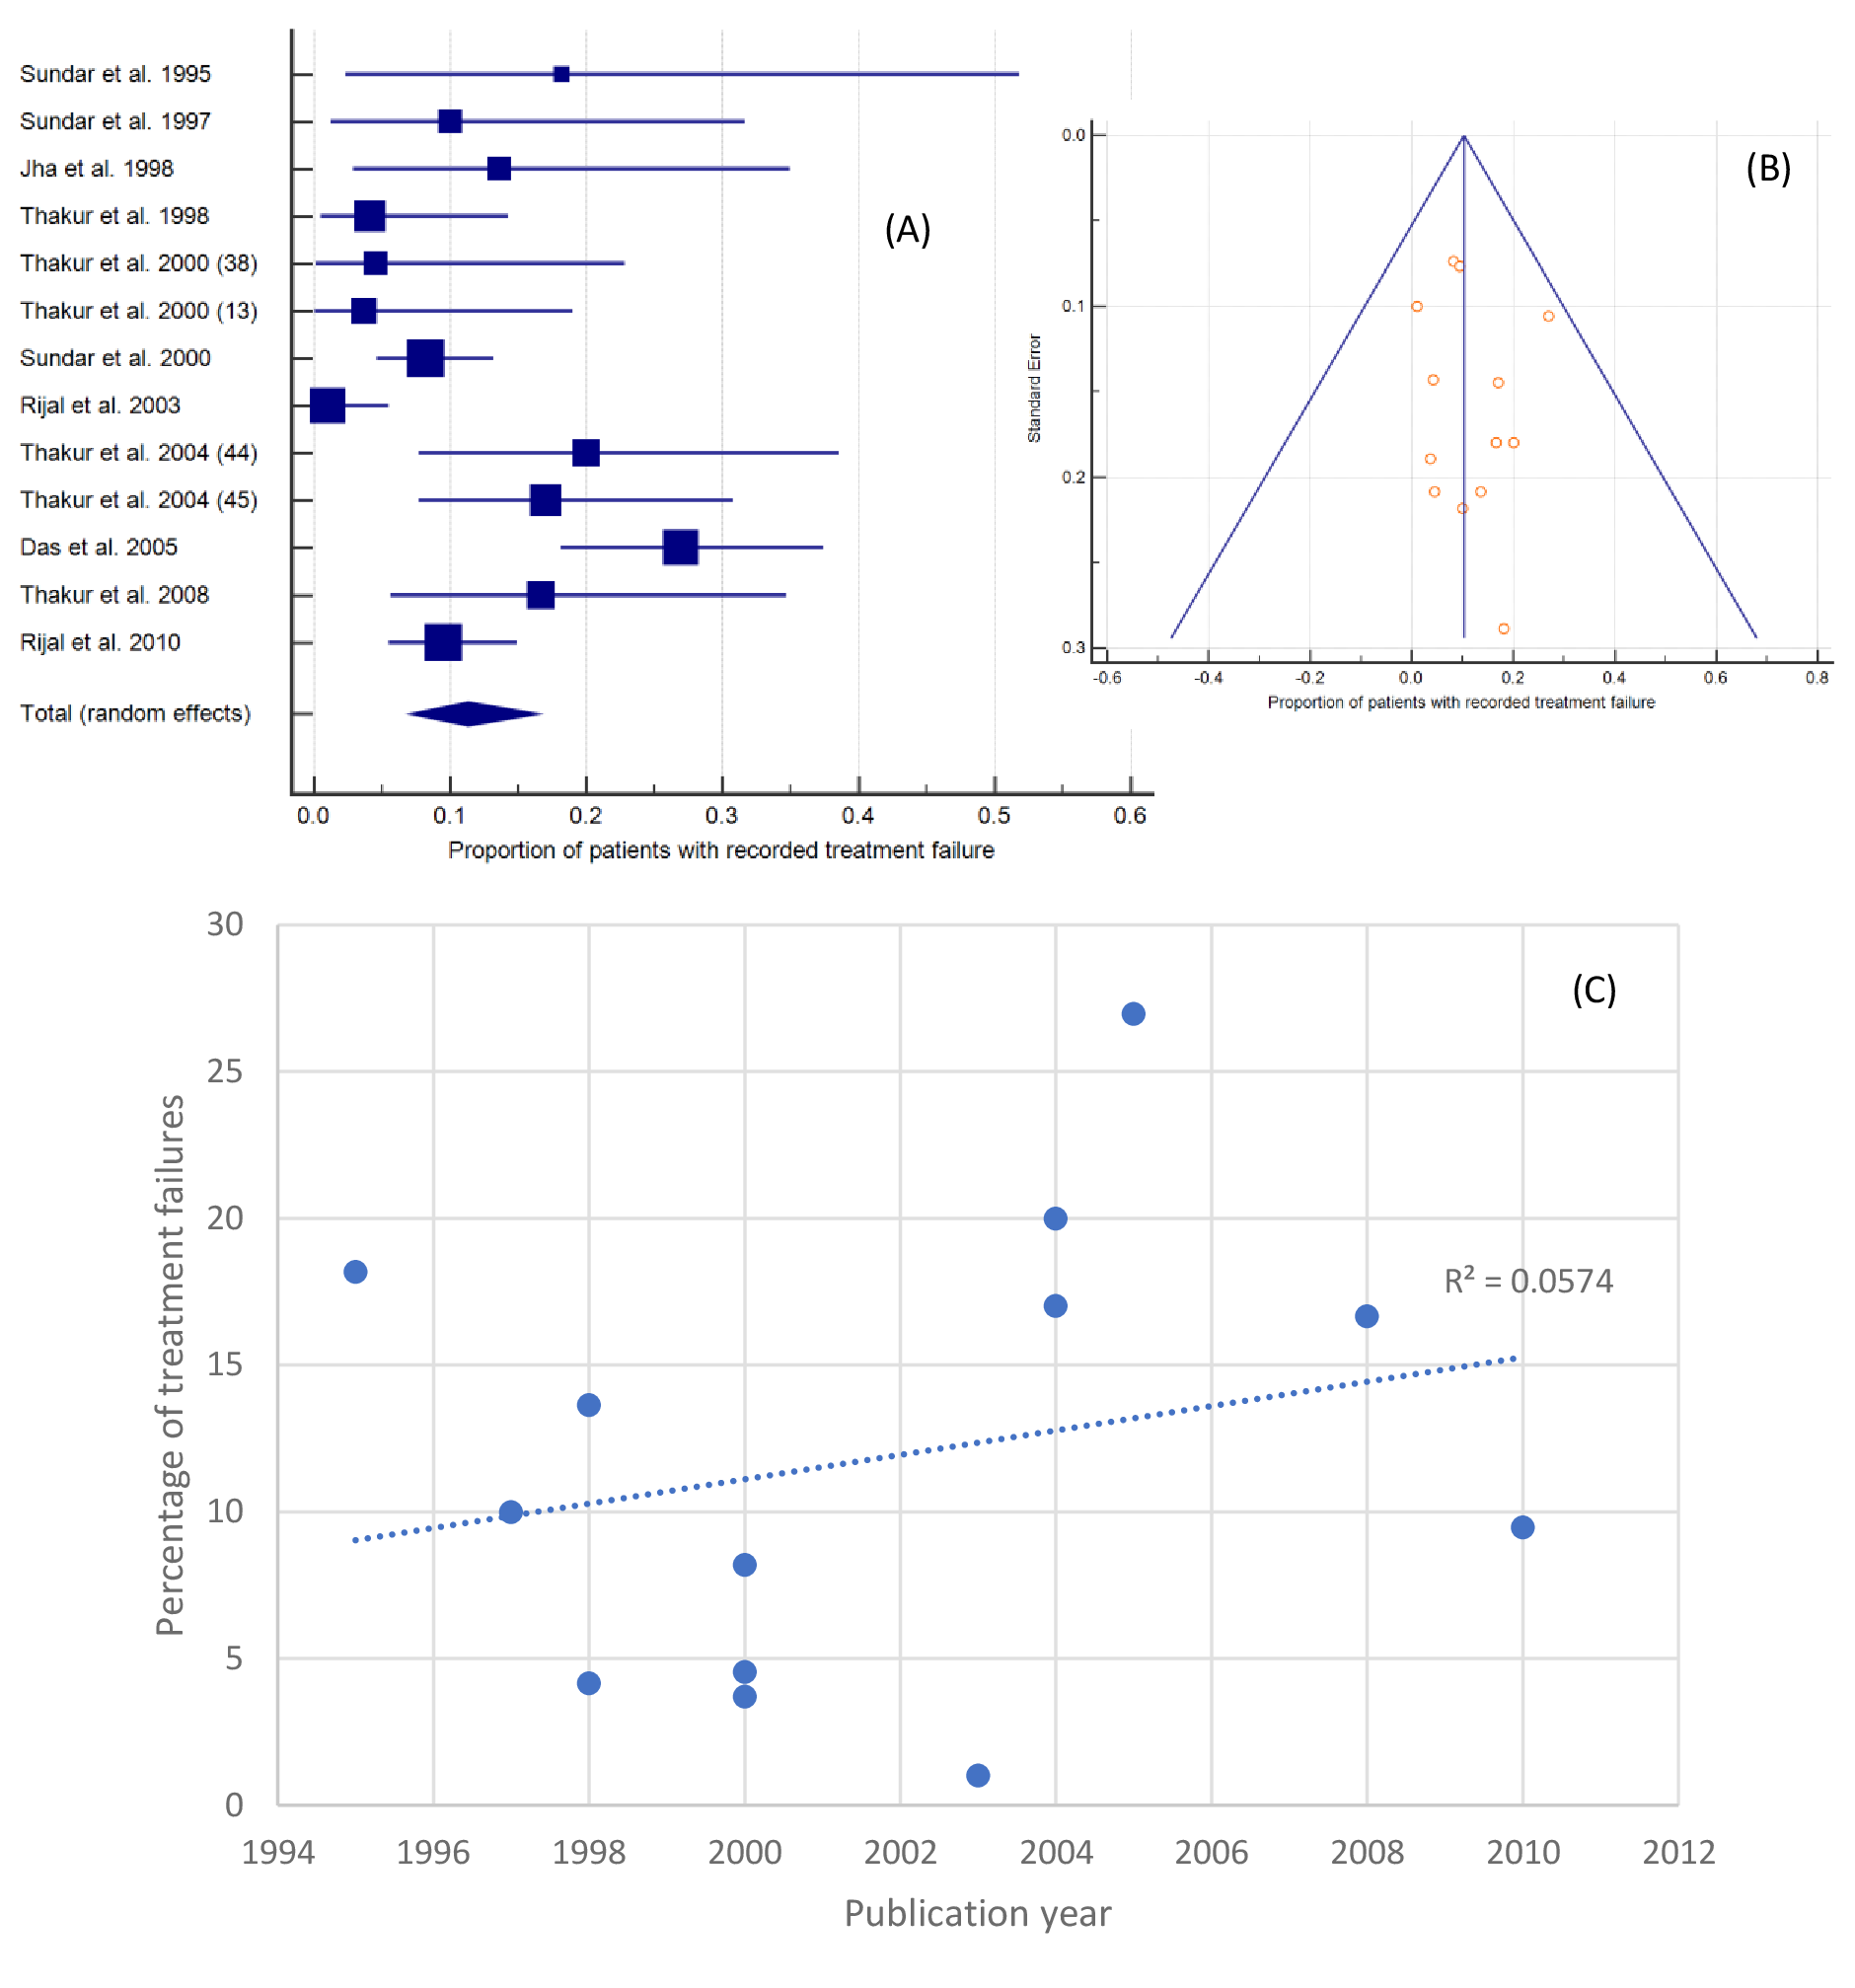
Figure 2, Panel A, shows that, across the region, the proportion patients found to have failed SSG treatment was 11.34% (95% CI=7.05-16.48%). The inconsistency between study findings was moderate, I2=74.44% (95% CI=55.86-85.20%). All forest plots are presented in the same way, the boxes show effect estimates for each study, weighted according to a random-effects model; the horizontal lines indicate 95% CIs; the centre of the diamond shows the pooled treatment failure rate and the horizontal tips represent 95% CIs. A funnel plot - on which the vertical line represents the summary estimate derived by fixed-effects meta-analysis and the diagonals represent 95% CIs around the summary effect - was found to be symmetrical (Figure 2, Panel B). When failure proportions were plotted by publication year (Figure 2, Panel C), the most recent studies were observed to have the highest rates of treatment failure, but the overall trend was negligible (R2=0.0574). The highest rate of treatment failure was 26.97% (95% CI=18.10-37.42%), recorded in a 2005 study of 89 patients in Bihar.14 The lowest rate of treatment failure was 1.01% (95% CI=0.03-5.50%) recorded in a 2003 study of 99 patients in Nepal.43

At a national level, 2/13 studies were conducted in Nepal. Meta-analysis of these data revealed a treatment failure rate of 4.83% (95% CI=0.09-16.13%); I2=89.64% (95% CI=61.62-97.2%) across 268 patients. Sub-analysis of the 529 patients drawn from the 11 studies conducted in northern India revealed a higher rate of treatment failure of 13.34% (95% CI=8.62-18.90%) and reduced inconsistency between study findings, I2=62.16% (95% CI=27.21-80.33%). Temporal analysis of the Indian data did not reveal a significant increase in the rate of treatment failure over time (R2=0.2299).
Six-month efficacy of SSG in East Africa
Three East African studies (Kenya n=1, Sudan n=1, and a mixed study across Sudan, Ethiopia and Kenya n=1) contained six-month follow-up data for a pooled population of 638 patients. Meta-analysis showed that the pooled proportion of treatment failure was 6.25% (95% CI=4.51-8.25%), with too few studies to accurately appraise inter-study inconsistency (I2=0.00%, 95% CI=0.00-96.47%). No funnel plot was generated for these data as the influence of chance increases with fewer than 10 studies.55 The highest rate of treatment failure (10.35%, 95% CI=3.90-21.17%) was recorded in a study that contained data from 58 Kenyan patients.40 Insufficient data was available for national sub-analyses.
The efficacy of Sb(V) treatment at the end of treatment
31 studies contained data regarding patient outcomes at the end-of-treatment (initial cure). In the majority of studies, 27/31, patients were treated with SSG, although in 4/31 studies MA was used.
End-of-treatment efficacy of SSG in the Indian subcontinent
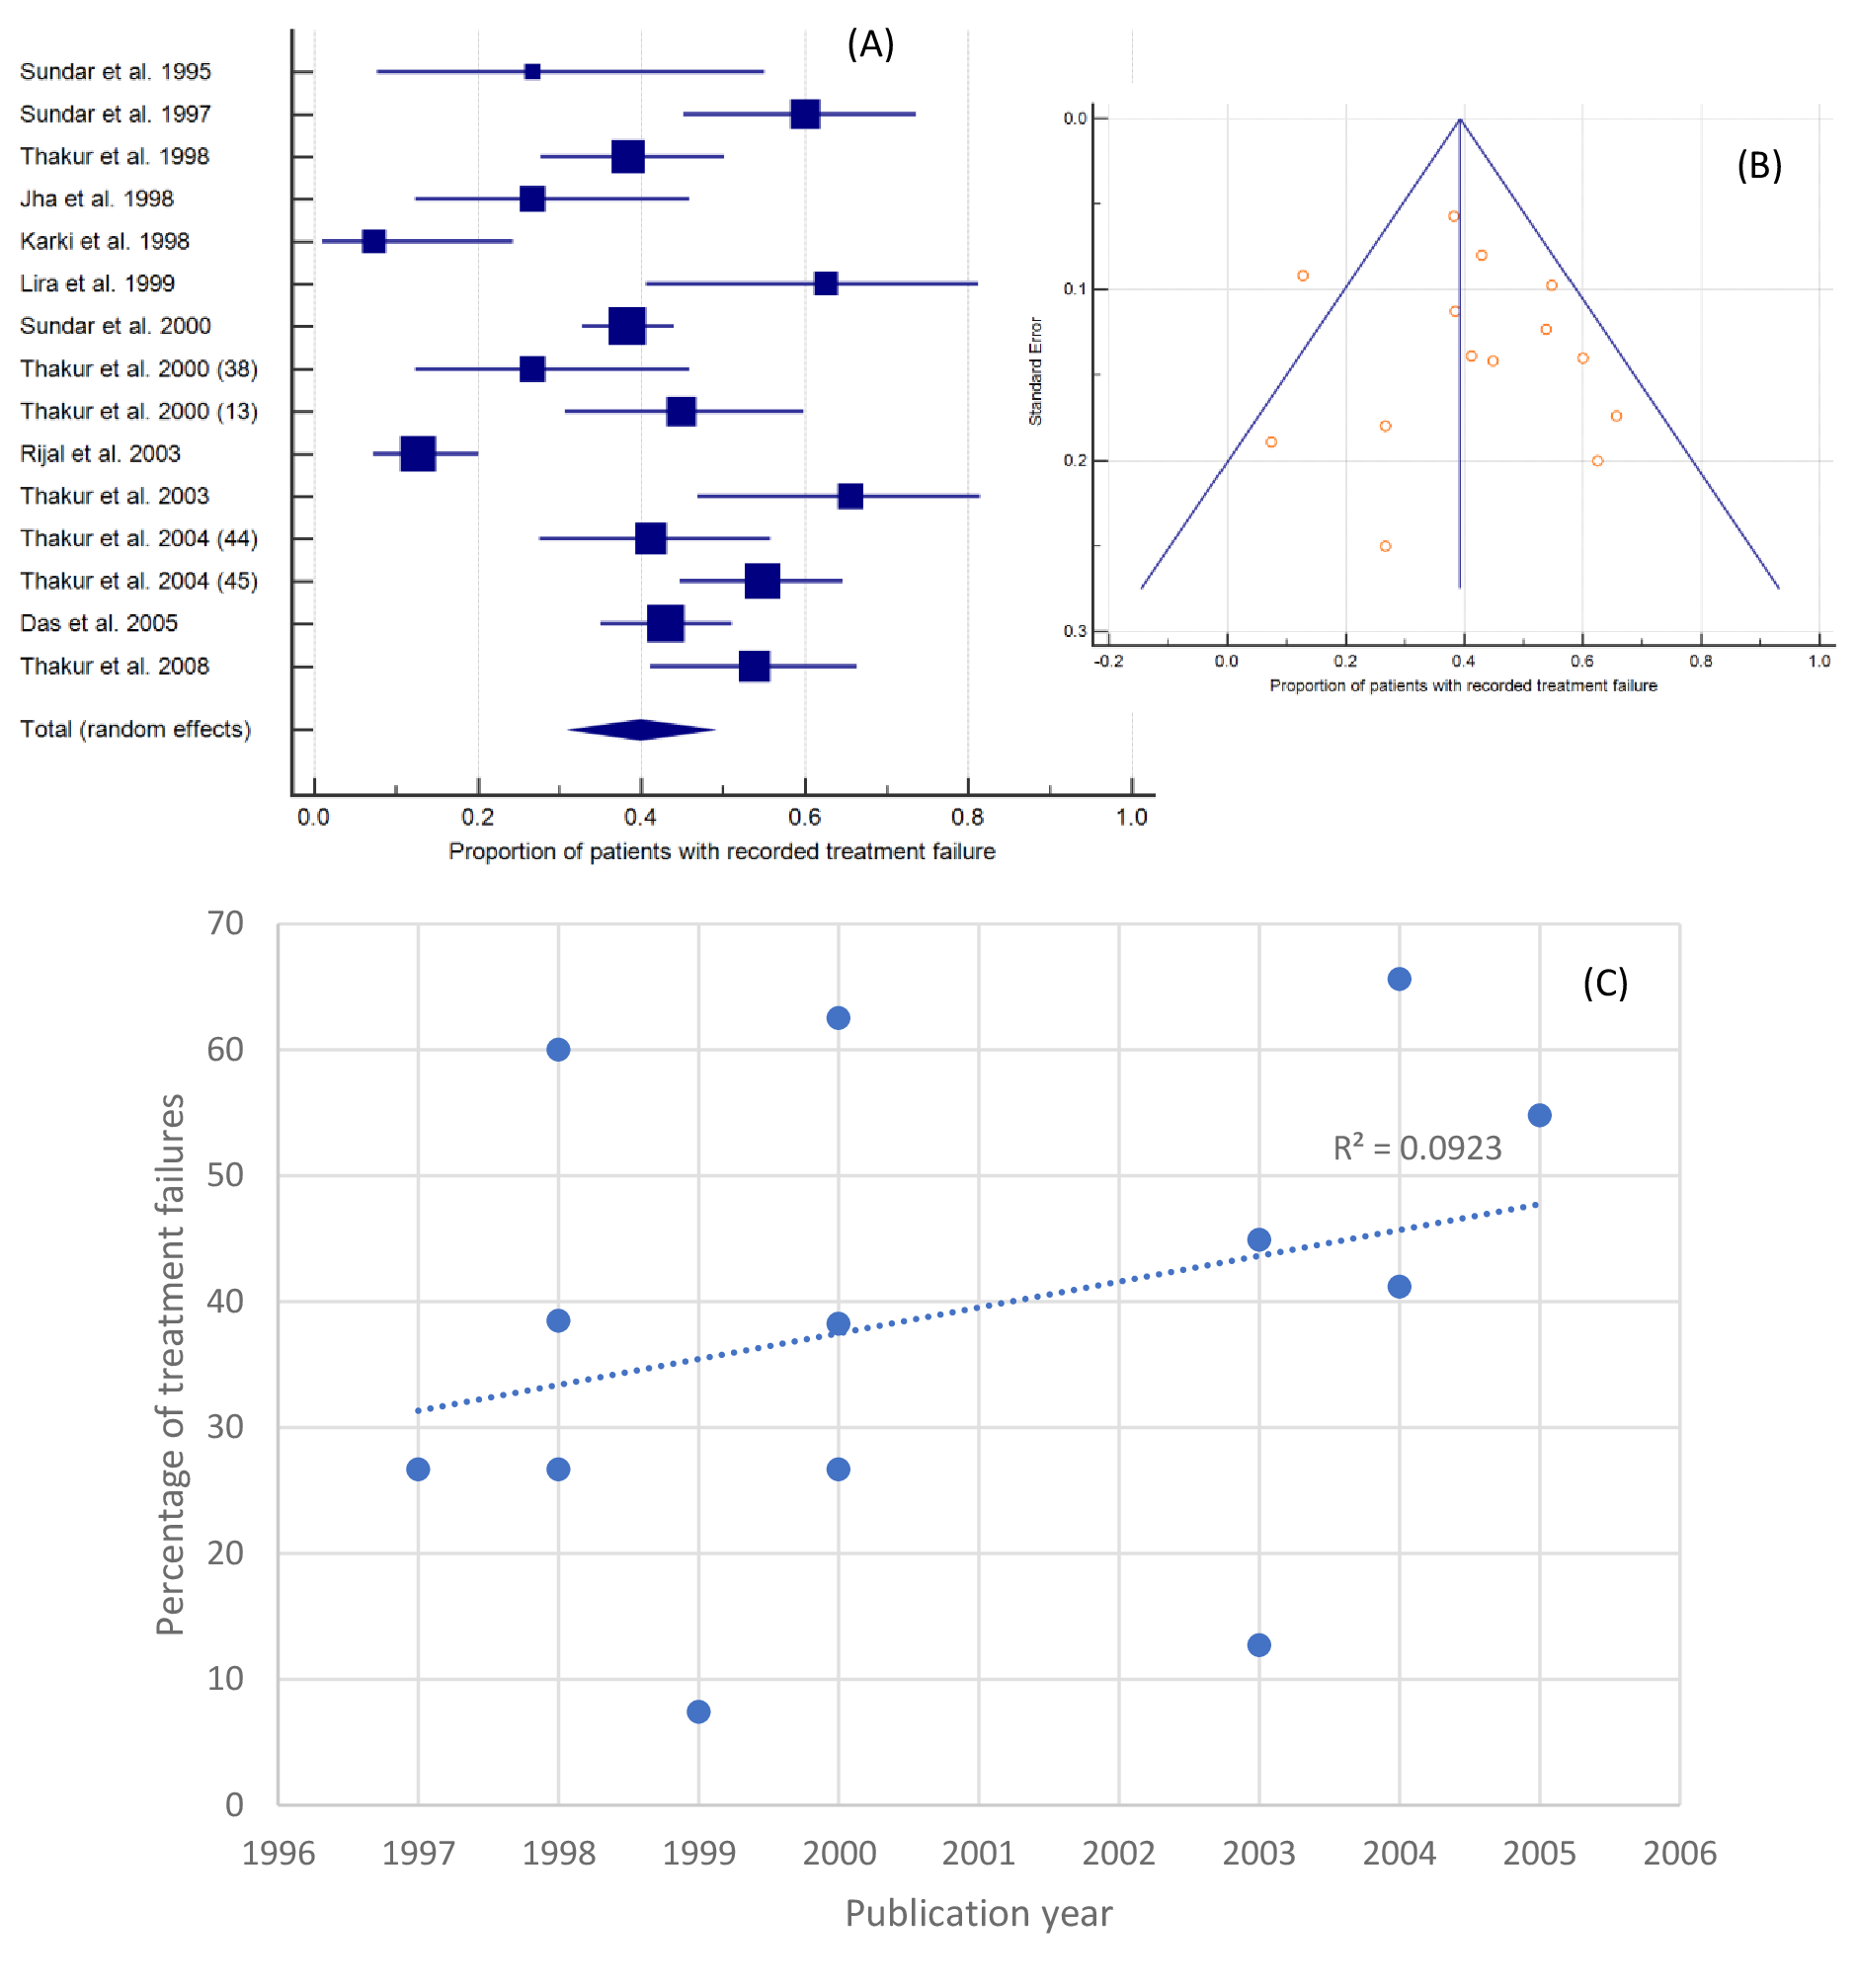
15 studies from the Indian subcontinent contained end-of-treatment outcome data, two from Nepal and 13 from the Bihar and/or Uttar Pradesh regions of northern India, representing 1,135 patients. Figure 3, Panel A, shows that 39.82% (95% CI=31.67-48.27%) failed SSG treatment (I2=86.86%, 95% CI=79.93-91.39%). A funnel plot of standard error against proportion of failures wasn’t notably asymmetrical (Figure 3, Panel B). Figure 3, Panel C, shows that there was no obvious increase in the rate of treatment failure over time (R2=0.0923). The highest rate of treatment failure was 65.63% (95% CI, 46.81-81.43%), recorded in a 2003 study of 32 patients in Bihar.41 The lowest rate of treatment failure was 7.41% (95% CI, 0.91-24.29%) recorded in a 1998 study of 27 patients in Nepal.34

Nationally, 2/15 studies contained data from Nepal, meta-analysis of these data gave a treatment failure rate of 12.17% (95% CI=7.40-17.93%); I2=0.00% (95% CI=0.00-0.00) across 145 patients. Sub-analysis of the remaining 990 patients drawn from the 13 studies conducted in northern India revealed a high rate of treatment failure of 45.21% (95% CI=39.31-51.17%) and reduced inter-study inconsistency, I2=67.19% (95%CI=41.32-81.66%). Temporal analysis of the studies from northern India revealed a greater magnitude of increase in the rate of treatment failure over time (R2=0.1406).
Only 14 of the 33 studies identified contained data about both initial and follow-up failure rates, 11 of these studies were from India. Given the large difference between the initial and follow-up failure rates identified thus far, we sought to confirm this pattern by repeating the analysis using only the data from the 11 Indian studies that covered both timepoints (n=528). This provided an initial treatment failure rate of 42.91% (95% CI=37.27-48.63%); I2=62.4% (95% CI=27.73-80.44%) and a follow-up failure rate of 13.38% (95% CI=8.65-18.96%); I2=62.25% (95% CI=27.40-80.37%).
End-of-treatment efficacy of SSG in East Africa
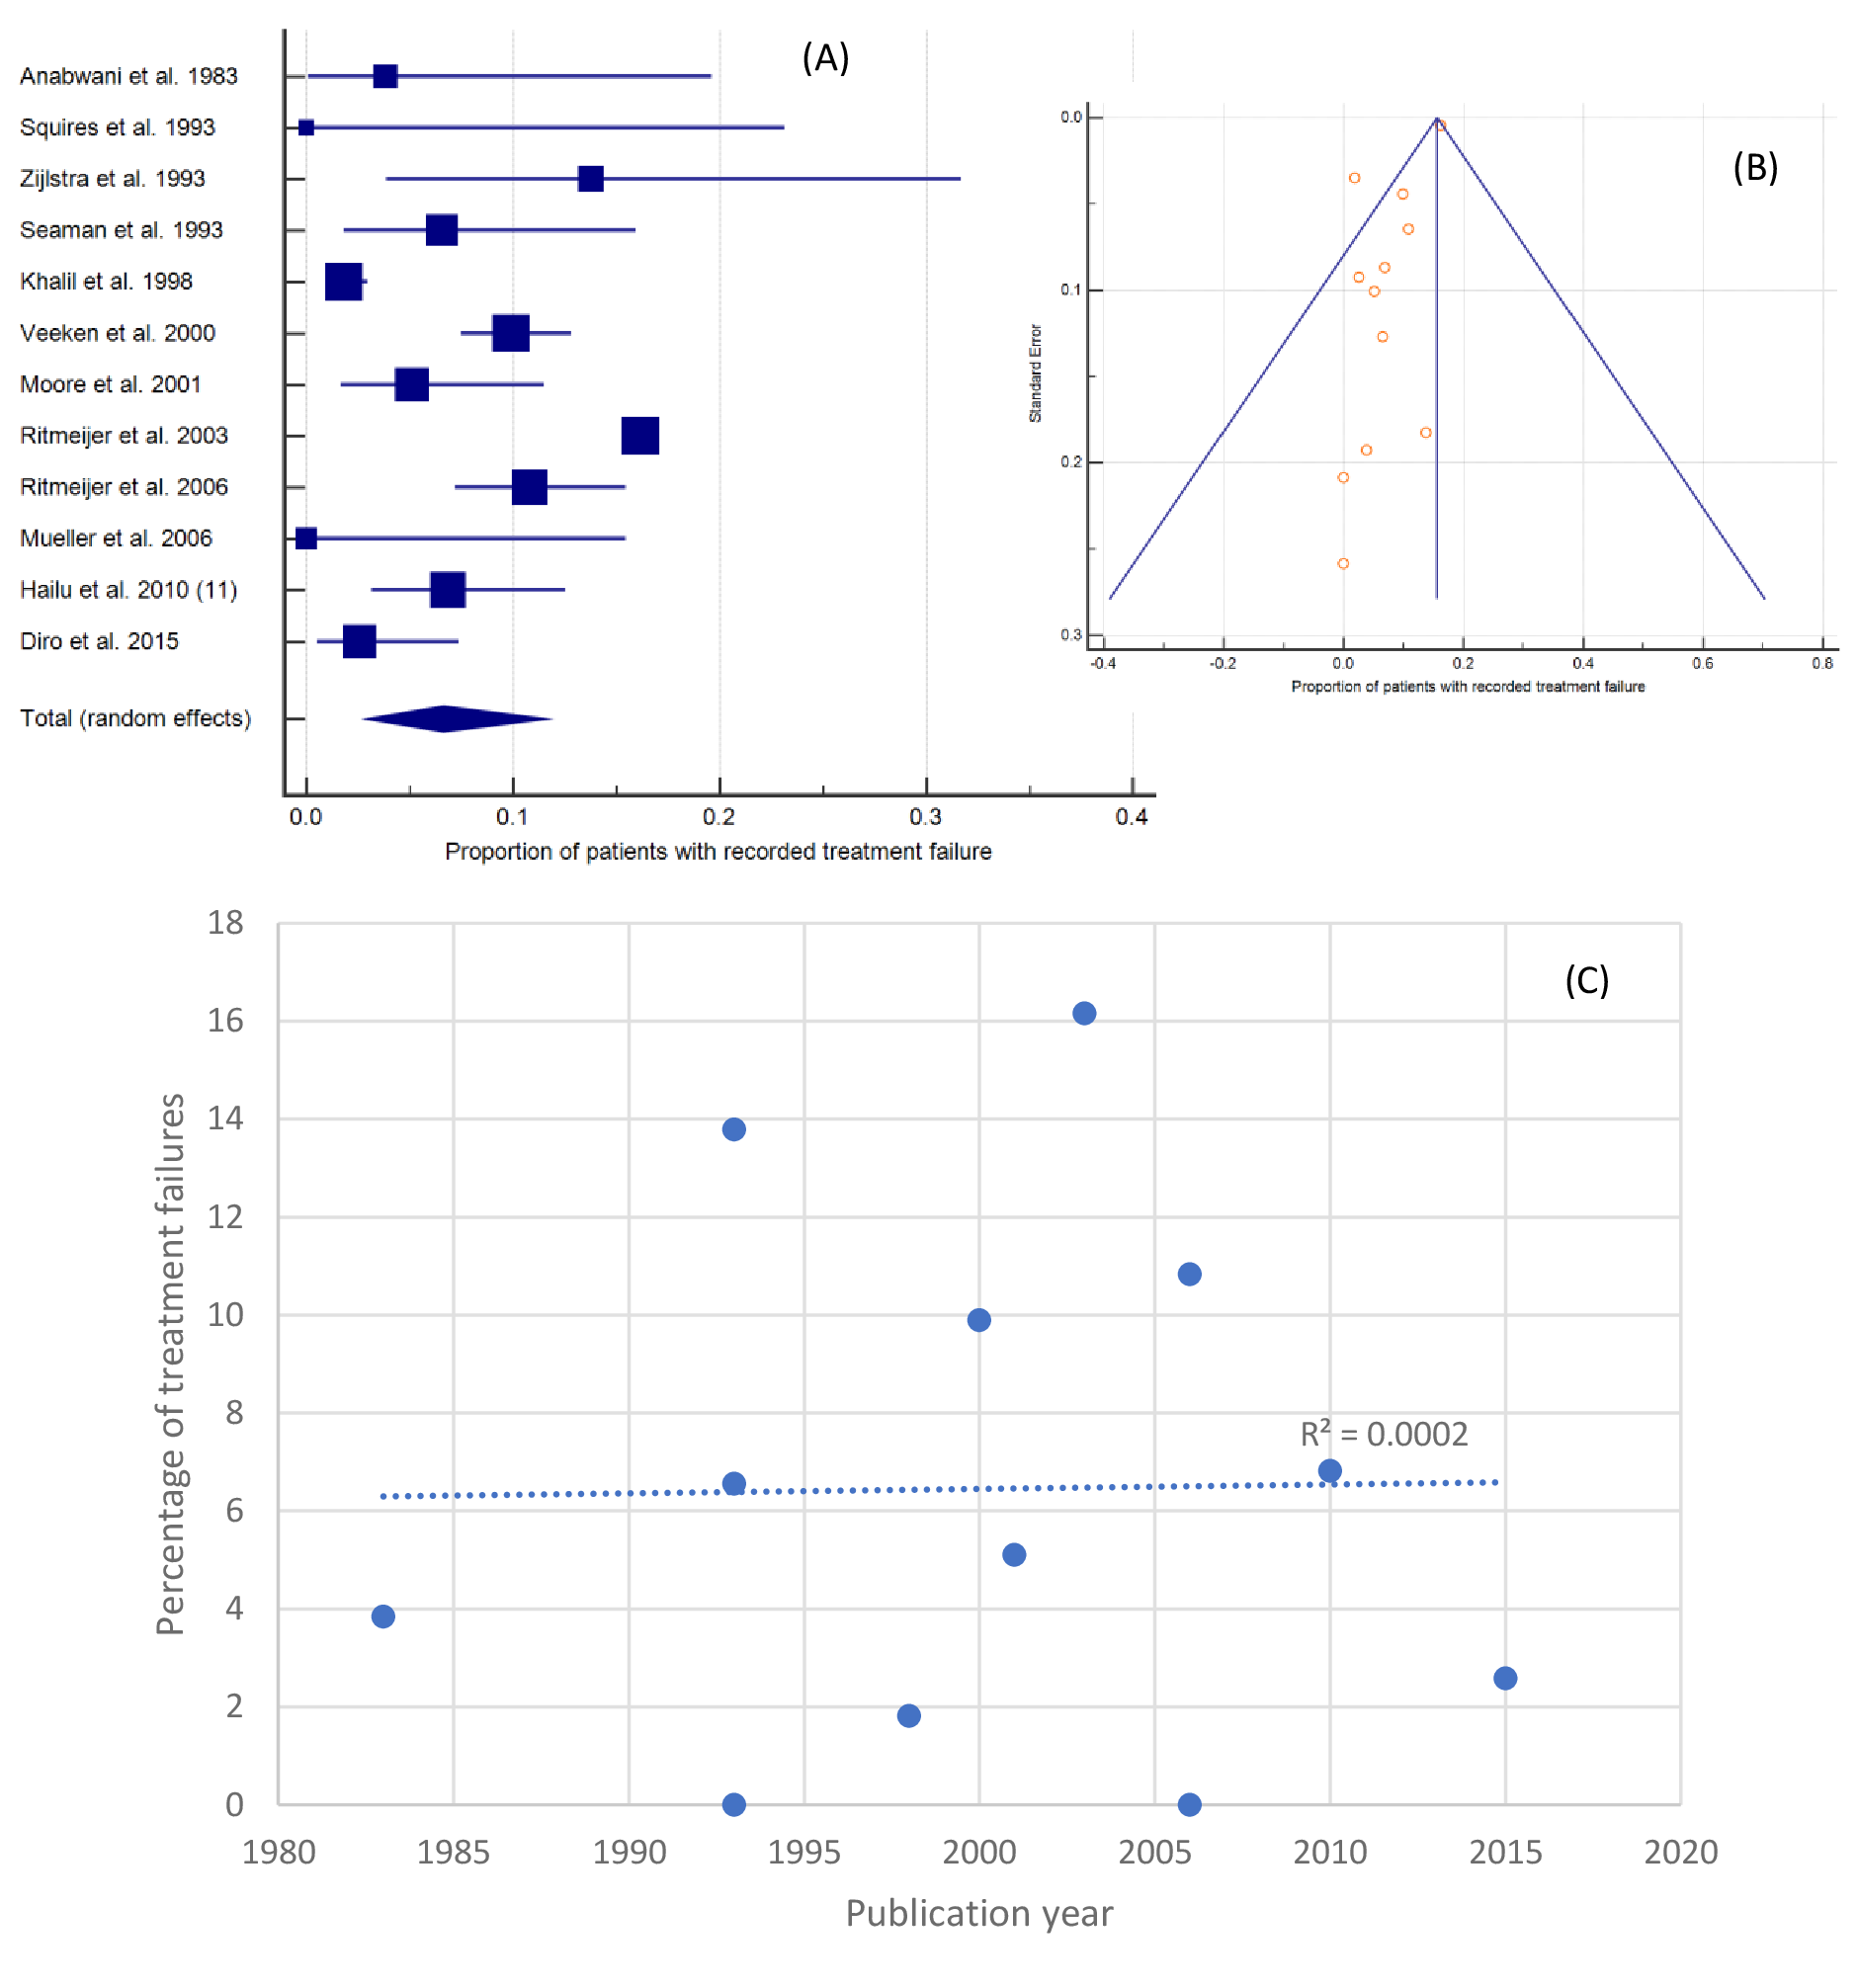
A total of 12 studies from East Africa (Kenya n=3, Ethiopia n=2, Sudan n=6, and a mixed study across Sudan, Ethiopia and Kenya n=1) contained end-of-SSG-treatment data, representing 53,335 patients. 96.1% of patients were drawn from one large retrospective study. While meta-analyses are weighted, to investigate the influence of this sample size all analyses were conducted with and without this large study population. When all 12 studies were included (Figure 4, panel A), the pooled proportion of treatment failure was 6.60% (95% CI=2.94-11.58%; I2=96.73%, 95% CI, 95.53-97.61%).

A funnel plot of all 12 studies appeared asymmetrical (Figure 4, panel B). The vertical line in a funnel plot represents the pooled estimate calculated using a fixed-effects model. In this case there was a marked discrepancy between the fixed- (15.63%, 95% CI=15.33-15.95%) and random- (6.60%, 95%CI=2.94-11.58%) effects estimates. This difference reflects the comparative influence of the weighting given by the fixed or random effects models to the smaller studies or the large 2003 study and was responsible for the appearance of the funnel plot. Repetition, excluding the large 2003 study provided a pooled population of 2,078 and gave more closely aligned fixed- and random-effects estimates of 5.19% (95% CI=4.28-6.23%) and 5.88% (95% CI=3.17-9.36%) respectively I2=84.63 (95% CI=74.12-90.87%); the funnel plot was found to be symmetrical, suggesting no publication bias. Temporal analysis (Figure 4, Panel C) did not reveal any change in failure rate over time.
Sub-analyses for Kenya, Ethiopia and Sudan revealed treatment failure rates of 5.01%, 6.56% and 7.57% respectively (Table 5). Exclusion of Ritmeijer and 2003 from the Sudanese analysis gave a failure rate of 5.96%.
End-of-treatment efficacy of MA
The four studies in which MA was used took place in Iran, Ethiopia, Uganda and Turkey and represented 257 patients. Meta-analysis of these data gave a treatment failure rate of 5.01% (95% CI=2.70-7.98%), and too few studies to accurately appraise inter-study inconsistency (I2=0.00%, 95% CI=0.00-85.86%). Insufficient data was available for national analyses and the small number of studies precluded generation of a funnel plot.
The influence of HIV-1 status
HIV-1 and VL both typically affect patients in lower socio-economic demographics. Of the 33 studies, the majority (19/33) didn’t report the HIV prevalence of their study population, while 14/33 excluded HIV+ patients (n=11) or reported a prevalence below 5% (n=3). To provide a better estimate of the failure rate of Sb(V), while acknowledging that HIV-1 can increase the rate of treatment failure,21,22 we sought to establish a threshold of acceptable HIV-1 prevalence for inclusion. The HIV-1 prevalence data for adults aged 15-49 from the study countries ranged from 5.9% (Uganda) to <0.1% (Iran).56 However, the HIV-1 prevalence among earlier study populations may be higher, reflecting the progressive roll out of ART. We sought to exclude studies that examined solely HIV-1+ patients or groups in which HIV-1 might be over-represented. Instead, we wanted to include populations in which the HIV-1 prevalence would reflect the wider national population. Given the range of HIV prevalence values identified for included studies, we therefore selected an arbitrary 5% threshold. Note that this led to the exclusion of one Ethiopian study which examined the efficacy of Sb(V) among HIV co-infected VL patients.57
Using SSG treatment data from East Africa and India, the locations in which most studies were performed, we compared failure rates from studies that reported an HIV-1 prevalence of <5% to those that did not report prevalence data (Table 6). The failure rate of the population with an unknown HIV-1 prevalence was not significantly different to that of the population with <5% HIV-1 for any of the Indian data. Among the African data, there was a significant (P < 0.0001) difference between the end-of-treatment failure rates reported in studies with <5% (5.09%) or an unknown (9.18%) HIV-1 prevalence. The significant difference remained after exclusion of Ritmeijer and Davidson 2003, (7.5% failure rate; n=690; P=0.028). No significant difference was reported at six-month follow-up.
DISCUSSION
Sb(V) are no longer recommended as a first-line therapy for VL, however Sb(V) monotherapy remains an important later treatment option in most regions if required.5 An appreciation of the Sb(V) treatment failure rate is therefore useful in guiding regional, national and clinical policy decisions.
In the absence of reliable molecular or genetic markers of parasite resistance, clinical treatment failure is often taken as a proxy for drug resistance.13–15,58 However, treatment failure ultimately represents the outcome of a complex interplay of host (eg, immunological, genetic and pharmacokinetic), parasite and drug factors.59,60 The clinical use of treatment failure as a proxy for drug resistance may therefore overestimate the prevalence of parasite resistance, but in the absence of molecular markers remains a valuable predictor of resistance.
The highest rate of SSG treatment failure was identified in northern India, where the rate of initial treatment failure (45.21%) was greater than that recorded at six-month follow-up (13.34%). Compared to the resistance rates recorded for other antileishmanial therapeutics in India,61 these data imply that Sb(V) monotherapy should remain a last-line treatment option. The discrepancy between the initial and six-month follow-up figures shows that the initial failure rate was greater than the relapse rate among patients that were initially treated successfully. The high rates of Sb(V) treatment failure recorded in northern India, particularly Bihar, are well-known.14 Several factors are thought to have contributed, including the misuse of Sb(V) in the region which may have driven parasite resistance. For example, it has been estimated that in 2011 only 26% of VL patients were treated with Sb(V) according to guidelines.62 It has also been suggested that high levels of arsenic in the drinking water in some parts of northern India may have selected for parasites with reduced Sb(V) sensitivity.63 Notably, temporal analysis did not show a significant increase in the rate of resistance over time. Given the high rate of treatment failure, it is unsurprising that Sb(V) is no longer recommended in the Indian subcontinent, except in regions where it remains effective.5 Among the latter is Nepal, which was found to have much lower failure rates, suggesting that the drivers of treatment failure are, wholly or partially, not present in Nepal.
The proportion of SSG treatment failures in East Africa was substantially lower than in India, perhaps reflecting a lower degree of historical Sb(V) misuse or arsenic contamination. The data from this study therefore suggest that Sb(V) monotherapy remains a valid treatment option in East Africa when the first-line therapy is unavailable or ineffective. There were 12 East African studies from which end-of-treatment data could be drawn, compared to 15 for the Indian subcontinent. In contrast, while 13 studies from the Indian subcontinent contained six-month follow-up data, only three East African studies did so. This may reflect greater difficulty in tracing patients, many of whom may have been nomadic.42
This study identified four articles (n=257) in which MA was used instead of SSG, and the failure rate of these studies was found to be 5.01%. Strict study selection criteria were applied to ensure comparability. However, as L. infantum often infects children many studies have used lower doses and/or shorter courses64,65 and these studies were therefore excluded from this analysis. Nevertheless, shorter courses of up to 21 days have been shown to be efficacious with low levels of treatment failure.52,66–68 Moreover, this likely explains why no studies from South America were identified, despite ongoing research there.
This analysis may somewhat overestimate the proportion of treatment failures for two reasons. First, HIV-1 infection is known to increase the rate of treatment failure.8,12 To increase the number or eligible studies, those with a cohort with greater than 5% HIV-1 prevalence were excluded while studies that did not report prevalence data were included. Analysis of the two largest SSG treatment datasets showed no influence of including studies with unreported HIV-1 prevalence on the Indian data. However, there was a significant influence upon the end-of-treatment data from East Africa. The higher failure rate among those without known HIV-1 status likely reflects the sum of the background failure rate and underlying HIV-1 prevalence. Future studies examining the efficacy of anti-leishmanial chemotherapeutics must account for HIV-1 prevalence. Second, this study assumed that the death rate from VL exceeded the treatment. However, there were studies in which patients died from drug toxicity or other causes, eg,44,45,49 and inclusion of these as treatment failures will lead to a slight overestimation.
The results of this study may also be limited by the moderate to high heterogeneity associated with the results. This is likely due to variations that couldn’t adequately be accounted for by sub-analysis because of insufficient volume or reporting of data to enable this - eg, national or patient variables such as ethnicity, age or unreported comorbidities. Further heterogeneity may arise from methodological diversity, including the use of parasitological or clinical test-of-cure. It’s important that future clinical evaluations of antileishmanial treatment efficacy report as much data about the participants as possible to enable future meta-analyses to explore and account for heterogeneity.
Taken together, this study supports current policy, confirming high rates of Sb(V) treatment failure in parts of the Indian subcontinent while comparatively lower rates exist in East Africa. Given that Sb(V) is no longer a first-choice treatment, future research is likely to focus on other chemotherapeutics, the efficacies of which will need to be carefully monitored. Such monitoring should continue to make use of meta-analyses to offer more highly powered studies where possible.
Acknowledgements
The authors wish to thank Dr Medhat Khattar (Division of Infection and Pathway Medicine, University of Edinburgh) for constructive criticism of the manuscript. JDJ would like to thank his wife, Mrs Helen Stacey, for helpful conversations. We are grateful to the two anonymous reviewers whose constructive criticism helped refine this manuscript.
Funding
This research was unfunded. Access to MedCalc was through a license provided by the Biomedical Teaching Organisation, University of Edinburgh.
Authorship contributions
Conceived and designed the experiments: JDJ, SCW; Performed the experiments: MJ, JDJ; Analysed the data: CMJ, JDJ; Wrote the manuscript: JDJ; Reviewed the manuscript: CMJ, SCW, JDJ.
Competing interests
The authors completed the Unified Competing Interest form at http://www.icmje.org/coi_disclosure.pdf (available upon request from the corresponding author), and declare no conflicts of interest.
Correspondence to:
Dr Joshua D. Jones, MA MRes PhD (Cantab) FHEA
Division of Infection Medicine
Edinburgh Medical School: Biomedical Sciences
University of Edinburgh
1 George Square
Edinburgh EH8 9JZ UK
[email protected]