
Assistive technology (AT) is an umbrella term which broadly encompasses assistive products (AP) and the related services which improves function and enhances the user’s participation in all areas of life.1 Assistive products are “any external products (including devices, equipment, instruments and software) […] with the primary purpose to maintain or improve an individual’s functioning and independence and/or well-being, or to prevent impairments and secondary health conditions”.2
Recently, awareness for the urgent need to improve access to Assistive Technology has expanded, as 2022 global population statistics highlights one in three people, or 2.5 billion people, requires at least one assistive product.1 The demand for AT is projected to increase to 3.5 billion people by 2050, yet 90% of them lack access to the products and services they need.1,3 A systemic approach which adequately measures outcomes and impact is urgently required to stimulate evidence-based policies and systems which support universal access to AT.1,4,5 However, a systemic approach first necessitates baseline understandings of the existing system, inclusive of sociopolitical context and the key stakeholders working within that context.
Assistive technology is necessary for people with disabilities to engage in activities of daily living, such as personal care or employment, and social engagement.6 Moreover, people with disabilities also require AT to enact their basic human rights, as outlined in the United Nations Convention on the Rights of Persons with Disabilities (UNCRPD).7 Unfortunately, many people do not have access to the AT they require, an inequity which is perpetuated within low-income settings.8 Despite this growing disparity and a well-documented association between poverty and disability,9 research gaps remain related to AT within low-income settings in the global South.10
In Sierra Leone, the national prevalence of disability is estimated to be 1.3%, according to the most recent population and housing census data.11,12 This is unusually low, as compared to the 16% global prevalence (World Health Organization, 2022). National stakeholders within the AT network argue this statistic does not adequately represent the true scope of disability in Sierra Leone.10 Their stance is supported by survey data from the Rapid Assistive Technology Assessment (rATA) across a subset of the population in Freetown, which indicated a dramatically different picture: a 24.9% prevalence of self-reported disability on the basis of the Washington Group Questions (20.6% reported as having “some difficulty”, while 4.3% rated “a lot of difficulty” or above), predominantly mobility and vision related disabilities.13 The rATA also highlighted 62.5% of older people surveyed indicated having a disability, while the incidence of disability among females was nearly 2% higher than in males.13
Despite the 2011 Sierra Leone Disability Act being implemented, access to AT in Sierra Leone remains poor.13 The rATA suggests only 14.9% of those with disabilities in Freetown have the assistive products they require, an alarming rate which also fails to consider people with disabilities not surveyed in rural Sierra Leone where access to such services is likely lower.13 Meanwhile, it is estimated over half of the population of Sierra Leone lives in poverty, with 13% in extreme poverty.14 As affordability ranks as the top barrier for AT access, poverty further perpetuates the challenges of people with disabilities within this subset of the population to access necessary AT.13 Within the context of low-resource settings it is therefore imperative that those resources which are allocated to provide assistive products are used in the most optimal manner, and that different stakeholders work together to co-construct a systemic approach which can identify and prioritise those most in need.
This paper presents a dataset collected in tandem with an Assistive Technology 2030 (AT2030) funded Country Investment project in Sierra Leone in collaboration with Clinton Health Access Initiative (CHAI). The study aimed to explore the nature and strength of the assistive technology stakeholder network in Sierra Leone over the course of one year through a mixed methods survey methodology. We provide a systemic snapshot of the AT network in Sierra Leone, highlighting what assistive products are available, who provides and receives them, and how. We also present a relational analysis of the existing AT network, inclusive of the organizations working within areas of AT and their degrees of connectivity and collaboration amongst one another. We hope that such data can strengthen the provision of AT in Sierra Leone through identifying assistive product availability, procurement, and provision, as well as the nature of the relationships between (the relationality) of the AT network. We also sought to provide an overview of any possible changes to the network over the course of a one-year investment by AT2030.
METHODS
This study used a mixed methods survey approach, facilitated by Qualtrics online survey software. Surveys were collaboratively developed and distributed at the two time periods in December 2021 and September 2022 (herein respectively described as Baseline=T1 and Follow Up= T2).
Intervention
This paper presents the Sierra Leone country project built within a larger, targeted investment in assistive technology systems development in four African countries,by AT2030, a project led by the Global Disability Innovation Hub and funded by UK Aid. The four in-country projects were administered by Clinton Health Access Initiative (CHAI) in partnership with local government ministries and agencies. As part of this investment, CHAI and its partners convened a Technical Working Group which brought together key stakeholders in the assistive technology field. Over the course of one year, the Technical Working Group had an overarching goal to develop and strengthen key assistive technology related policies in each of the four countries. The data in this study on the AT network in Sierra Leone was collected at the outset and following completion of the AT2030 investment, by researchers who were not part of the investment process, thus allowing for third-party evaluation. To maintain objectivity, neither CHAI nor the funder were responsible for the design, data collection, analysis or reporting of results, but this paper has benefited from a programmatic perspective provided by CHIA.
Participants
Participants included members of relevant ministries involved in assistive technology leadership and/or delivery, and staff representing relevant non-profit organizations (both international and local), service providers and organizations for persons with disabilities. Participants were asked to respond on behalf of their organization. All prospective participants were identified by the researchers and local project partners, including those coordinating the investment identified above, and added to a distribution list on Qualtrics, which only contained pertinent identifying information such as name, organization, and email. Over the course of the study, n=20 (T1) and n=16 (T2) participants consented to and completed surveys. While the relatively small sample size may inherently restrict the generalizability of this study, the sample size is reflective of the size of the assistive technology network in Sierra Leone, which we aimed to explore.
Data collection
The survey was emailed to the distribution list at two time points: December 2021 (T1) and September 2022 (T2). Two reminder emails were sent out via Qualtrics at two-week intervals following each time point, to participants who had not yet completed the surveys as a means to stimulate participant retention. The T1 and T2 surveys were identical, however the T2 survey utilized display logic functionalities such as conditional skipping to prevent retained respondents from completing redundant questions such as demographic information. If a participant completed the survey for the first time during the T2 period, they received the survey in its entirety without conditional skipping.
Survey content
Survey questions aimed to capture what AT is available, how it is being provided, who is receiving it and how. Questions also consisted of demographic information and qualitative prompts to identify participants’ roles within the AT network and critical challenges experienced in enacting their roles, as well as the nature and strength of relationships between stakeholders. Additional data was collected on participatory engagement in policy development, knowledge of assistive technology, and capacity for leadership which will be published separately.
Using the methodology reported by Smith and colleagues,15 the WHO priority assistive products list was provided for respondents to select the products and associated services their organization provides. Additionally, the survey requested respondents to select from a list of organizations, which ones they were aware of as working within AT areas in Sierra Leone, followed by a subsequent 5-point Likert scale (1-5, 1= no relationship, 5= collaboration) to indicate which organizations they had working relationships with and to what extent. In attempts to maximize response rates and maintain participant retention, two reminder emails were sent to participants for T1 and T2; however, challenges encountered were participant drop-out from T1 to T2.
Data analysis
Data was reviewed across the two time periods and descriptive statistics (counts and means) were calculated for all variables using MS Excel software. Qualitative data employed content analysis of the text responses from each open-ended survey question, with a particular emphasis on themes which represented commonalities or a lack of representation across all stakeholders. Network data was analyzed using the NodeXL software and MS Excel to generate visualizations, and specific metrics related to indegree, betweenness and closeness centrality of organizations grouped by organization type. Indegree represents the total number of incoming connections per organization, while weighted indegree represents the sum of weights (strength) of each connection. Closeness centrality represents the relationship of the organization to the centre of the network (lower scores indicate greater centrality). To accommodate for different response rates at baseline and follow up, indegree was calculated as a proportion of incoming connections out of the total respondents (n) for that time point. Weighted indegree was calculated as a proportion of the sum of weights of incoming connections divided by the total possible weighting for the respondents for that time point (i.e. n*5). Statistical comparisons for overall network metrics across T1 and T2 were calculated using a paired t-test in SPSS v.28. While means are also reported by organization type as a subsample of the overall data, no statistical tests were carried out due to small subsample sizes.
Ethics
The study received ethical approval from Maynooth University and the Sierra Leone Ethics and Scientific Review Committee. Each survey contained a mandatory informed consent section which required completion prior to respondents accessing the survey questions. Respondents were not required to answer any specific questions and were not coerced to participate. All respondents received a unique identification code to preserve anonymity, and any identifying information was removed prior to data analysis.
RESULTS
A total of 27 participants from 24 organizations participated in the surveys across both baseline and follow-up time points (T1 n=20 and T2 n= 16). Nine individuals and 11 organizations were retained across both T1 and T2 surveys. The majority of participants represented International non-governmental organizations (n=9), followed by Organizations of Persons with Disabilities (n=8), Government Ministry (n=4), Service Delivery organisations (n=4) and Academic Institutions (n=2).
Additionally, the respondents were requested to identify multiple areas of AT that their organizations were aligned with. Advocacy ranked as the top selection (24.5%), followed by direct service provision (14.9%), human resources and capacity building (14.9%), policy or systems development (13.8%), product selection and/or procurement (13.8%), data and information systems (11.7%), and financing (6.4%).
Assistive Products in Sierra Leone
Participants were asked to select from the APL which products and/or product services they provide. Manual wheelchairs, crutches, canes, lower limb prosthetics and orthopaedic footwear were the most selected across both time points. Table 1 lists summarises the types of assistive products and services provided in Sierra Leone, and the number of organisations providing each product and/or service across all 50 APL products.
Respondents indicated that the products they provide were most commonly procured by their organizations through purchase (38.7%), followed by donation (29%), building products themselves (22.6%) or other (9.7%), which was explicated as recycling used products.
Providers of Assistive Products in Sierra Leone
Participants were asked to indicate whether their organization provided assistive products and/or related services. The findings highlighted 38.3% of stakeholders directly provided AT and 40.4% directly provided AT related services to beneficiaries, while only 21.3% indicated they do not provide AT or AT related services at all.
More specifically, respondents who did indicate providing products and/or services indicated they provided the following services: provision of locally made assistive products, repairs and maintenance of assistive products, education and training of users on the utility of assistive products, referrals of people with disabilities to service providers, prosthetic and orthotics, accessibility assessments, and rehabilitation service provision. Participants whom do not directly provide AT or AT related services indicated their work falls within AT advocacy, fundraising, procurement, policy, and research.
When asked about the challenges they experienced procuring and distributing these products to beneficiaries, qualitative data indicated difficulty sourcing materials, challenges obtaining products due to poor infrastructure, poor quality standards and/or customizability of products, and low technical and managerial support as common barriers. High product and material costs and inadequate funds from both the organizations and beneficiaries was the most commonly cited challenge.
Beneficiaries of Assistive Products in Sierra Leone
When probed on the number of clients they served each month, respondents indicated the range of beneficiaries spanned from as little as 10 per month to upwards of 1000, while one respondent noted there was no fixed number as they serve at the national level. Respondents noted that their beneficiaries were predominantly people with mobility related disabilities or functional limitations (21.4%), closely followed by people with vision disabilities (17.9%), communication disabilities (15.4%) and hearing disabilities (13.1%).
Participants emphasized children and adolescents were the highest populations served, with an equal representation among the ages of 5-12 (23.7%) and 13-18 (23.7%). Adults aged 20-50 years (21%) closely followed, while children under 4 (15.8%) and adults over 50 years of age (15.8%) are equally less represented as beneficiaries of assistive products and services in Sierra Leone.
Respondents whose organizations provide assistive products indicated that their beneficiaries most commonly received APs free of cost (63.2%), followed by client payment (26.3%) and a fixed cost structure (10.5%).
Network Analysis
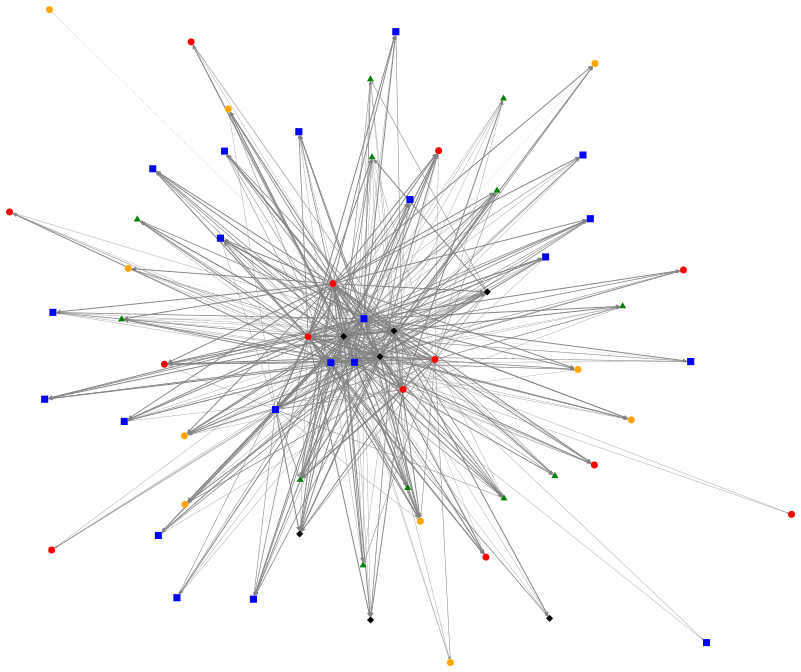
Respondents were asked to indicate which organizations in the AT network they were aware of, and subsequently to rate the strength of their relationship with the organizations they indicated an awareness of. The degree of relationality among these stakeholders involved in the assistive technology network was then analyzed across the two time points and organizational relationships were visualized using the NodeXL software, presented in Figure 1 and Figure 2. The colored nodes in the figures depict the various sub-types of organizations, while the lines between the nodes represent their relationships, with thicker lines indicating stronger relationships. The red nodes represent government ministries and agencies, the green represent service delivery organizations, blue represents organization of persons with disabilities, black represents NGOs and yellow represents academic institutions.
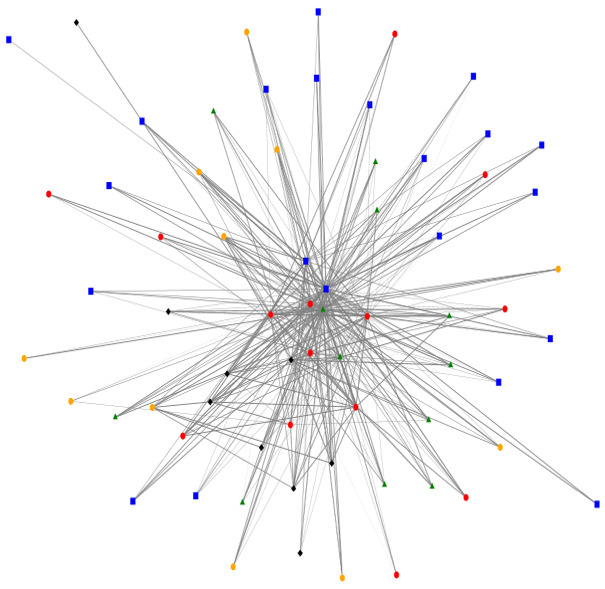

Overall, this representation depicts a relatively centralized network with a higher degree of connections between organizations. Furthermore, ministries and government agencies appear towards the centre of the network, indicating a relatively greater role in connecting organizations to one another, however it is noteworthy that these are not the most central organizations in the network.
Table 2 provides quantitative data which demonstrates the overall number and strength of interconnections among the organizations within the assistive technology network in Sierra Leone. Indegree is the number of identified inward connections, or the number of other organizations who identified a connection with that organization. Indegree data are presented as a mean value per organization type to preserve anonymity. The data visualized in Table 2 significantly increased over one year from baseline to follow up, while the relative centrality of organizations did not change, at least over the one-year time period of this study.
Overall, there was a statistically significant increase in indegree scores between the two timepoints suggesting a higher level of connection among AT organizations in Sierra Leone following the 1-year investment. This suggests those organizations built more relationships and expanded their reach within the AT network. As relationship strength was measured on a 5-point scale (no awareness, awareness, communication, cooperation, collaboration), we can interpret increases in weighted indegree to suggest greater inter-organizational working between members of the network (please refer to Table 2).
These findings suggest the one-year intervention did indeed stimulate change within the AT network in Sierra Leone, increasing the number connections within the AT network, and strengthening existing relationships within the network.
DISCUSSION
The most common assistive products available in Sierra Leone were indicated to be manual wheelchairs, crutches, canes, lower limb prosthetics and orthopaedic footwear. This aligns with our participants ranking mobility related disabilities or functional limitations as the most common reason for beneficiary referral, as well as the rATA data13). The global report on AT notes “the type, complexity, magnitude and duration of a humanitarian crisis impacts the need for and supply of assistive technology”.1 When we factor in the sociopolitical context of Sierra Leone and its history of civil war, and the population requiring these products due to political violence, such as lower limb amputations, it is also not surprising that mobility related products are so widely available due to population need. Moreover, as many low-income settings procure their products through donations, often from abroad, these items are probable to be in high circulation in relation to the high global prevalence of mobility related disabilities, likely shaping what products donors perceive as being most relevant.1
Interestingly, data from the rATA shows the people with disabilities who did have AP, most often obtained their product(s) through purchase, despite cost being the most significant barrier to access.13 As such, these APs were often purchased through informal and unregulated providers who offer lower costs, such as market vendors.16 In comparison, our findings demonstrated AT stakeholders providing AP did so predominantly at no-cost. This discrepancy could suggest those who need AT most are not aware of the regulated providers who offer free AP and/or AP services in Sierra Leone, or they simply cannot access them due to infrastructural barriers, or not having AT needed to navigate their environment in the first place. For example, our data highlighted only two organizations offering spectacles, yet the rATA indicated spectacles as being the most common AP obtained by people with disabilities sampled in Sierra Leone. This further supports our interpretation that access to free APs is limited if only a small subset of regulated providers are offering them, leading to an increased reliance on people with disabilities procuring APs from informal and unregulated providers in Sierra Leone. An interconnected and coherent national AT network could offer a way forward, should collaborative relationships among AT stakeholders continue to forge and their collective resources, contacts and beneficiaries were to be cross-pollinated for the advancement of beneficiary access.
As technology and what constitutes as AT continues to advance, juxtaposed with the prevalence of disability increasing, there is a risk that the gap in access to AT will continue to rise.17 It is therefore paramount that the goal of improving AT related outcomes, such as improved access to AT for all, is first warranted by the measurement of such outcomes.4 This paper has attempted to provide a systemic snapshot of the AT network in Sierra Leone, highlighting key information such as what assistive products are presently available, who provides them, who receives them (and how), and the relational cohesion of the network itself.
This paper is the first to demonstrate that a targeted investment in assistive technology systems and policies at the national level can have a resulting impact on the nature and strength of the assistive technology ecosystem relationships. It is therefore recommended as an intervention to engage stakeholders within the assistive technology space, in particular policy makers who have power to formulate AP related policy and access. However, this work is limited in scope as it only provides a reassessment of outcomes following the one-year investment, and does provide a more longitudinal evaluation of the impact of that investment in the longer term.
Future research is recommended to replicate the work done to date to evaluate whether there is an improvement in access to assistive technologies over a longer period of time as a result of targeted policy and systems change, as well as larger impacts on policy formulation for AP access. For example, attention to data collection of which types and categories of AP are being manufactured locally can inform policy formation to encourage continuity of local manufacturing, while improving access to AP. Moreover, further studies to investigate factors influencing limited uptake of free AP by persons with disabilities, as explicated above and discovered in this study, are recommended.
CONCLUSIONS
Cohesive AT networks are particularly important in low-income settings such as Sierra Leone, where the intersection of poverty and disability disproportionately reduces people with disabilities’ access to the AT they need. Power and colleagues18 have proposed the Assistive Technology Embedded Systems Thinking (ATEST) Model as a way of conceptualising the embedded relationships between individual-community- system-country-world influences on assistive technology provision. This paper suggests that even where resources are scarce and systemic relationships are uneven, an internationally-funded investment, which embraces the participation of country-level stakeholders and service providing organisations can result in enhanced inter-organisational working, which in turn has the potential to use existing resources more optimally, allowing greater access to services for individuals most in need.
The findings of this paper demonstrate an increase in organizational collaboration can strengthen assistive technology networks, however key barriers to access remain cost for both organizations providing AT and people with disabilities to obtain AT. Future work should use systemic approaches to leverage organizational relationality and prioritize financial accessibility of AT within systemic approaches to AT policy and practice, to leverage existing resources (particularly no-cost AT) and advance towards the ultimate goal of increased access to AT for all.
Ethics Statement
Ethical approval for the study was granted by Maynooth University and the Sierra Leone Ethics and Scientific Review Committee. The study involved human participants but was not a clinical trial. All participants provided informed consent freely and were aware they could withdraw from the study at any time.
Data Availability
All data generated or analysed during this study are included in this article.
Funding
This work was funded by the Assistive Technology 2030 project, funded by the United Kingdom Foreign Commonwealth Development Office (FCDO; UK Aid) and administered by the Global Disability Innovation Hub.
Authorship Contributions
Stephanie Huff led the manuscript preparation and contributed to data analysis. Emma M. Smith led the research design, data collection, analysis and contributed to manuscript preparation. Finally, Malcolm MacLachlan contributed to research design, analysis, manuscript review, and supervision. All authors read and approved the final manuscript.
Disclosure of interest
The authors completed the ICMJE Disclosure of Interest Form (available upon request from the corresponding author) and disclose no relevant interests.
Correspondence to:
Emma M. Smith
Maynooth University
Maynooth, Co. Kildare
Ireland
[email protected]