
Ciprofloxacin (cipro), a broad-spectrum antibiotic from the fluoroquinolone class, is used to treat a wide range of infections caused by susceptible bacteria (eg, respiratory, urinary tract, intestinal illness).1,2 It is one of the most widely used antibiotics in the world, in both animals and humans, due to its efficacy, safety, and relatively low cost.1 However, evidence suggests that the widespread availability and use of substandard cipro has increased the risk of antimicrobial resistance (AMR),3,4 disproportionately affecting developing countries with less stringent pharmaceutical regulation.2,5–10 The World Health Organization estimates that up to 10% of medications worldwide are counterfeit (passed off as real without being evaluated for quality, safety, and efficacy) or substandard (poor-quality). Of these medicines, 50% are estimated to be antimicrobial agents of which 78% stem from Asia and Africa.11
Specifically, in the case of cipro, many studies have exposed startling rates of substandard formulations. For example in 2002, Prazuck et al. collected three generic oral formulations of cipro manufactured in India and upon quality testing, found that two out of the three formulations varied in ciprofloxacin content by more than 20%.11 In 2005, Weir et al. collected cipro eye drops sold in India and found that 20% of samples contained concentrations below the recommended range.12 Additionally, in 2009, Bate et al. showed that 10% of cipro treatments collected in Delhi, India failed at least one of two quality tests.13 This widespread distribution of poor quality cipro, and the linkage to resistant bacteria, is in part due to a lack of regulatory policies governing appropriate manufacturing and quality assurance.2
Many methods are used to assess the quality of cipro formulations, including the ‘gold-standard’ high performance liquid chromatography (HPLC) and the ‘field-standard’ thin-layer chromatography (TLC).11–13 Currently, HPLC is the main analysis method for pharmaceutical formulations but is prohibitively expensive for applications in low-resource settings, costing upwards of US$ 100,000 with reoccurring annual costs of approximately US$ 20,000.14,15 Additionally, HPLC requires a centralized laboratory containing the instrument, as well as trained technicians to run it. These demands cause logistical problems in low-resource settings and are almost never met. To overcome the barriers of expensive, centralized testing, TLC is used for analysis of pharmaceutical formulations in the field, specifically through a platform called Minilab. Minilab, comprised of two 45-kilo suitcases containing all necessary testing reagents, is used specifically for applications in resource-limited settings and is recommended by the WHO for detection of substandard drugs in these areas. But because of the nature of TLC, Minilab can only be used to determine substandard drugs qualitatively. This leaves a gap in our ability to assess quality of cipro in a precise, quantitative, field-ready manner.
In an attempt to bridge this gap, other groups have worked to develop assays for cipro quality, using various spectroscopy techniques such as absorbance and fluorescence.16–21 Many of these assays utilize toxic or corrosive chemicals and require an expensive spectrophotometer in a centralized lab with trained personnel and multiple sample preparation steps. So even though these assays are lower cost than traditional HPLC, they still incur these barriers in translation to the field.
To fill this gap, we have developed a low-cost assay to determine quality of cipro in tablets. Substandard formulations have been suggested to be one of the major forces driving AMR to cipro and therefore, quantitative, portable tests are necessary for screening.3 We modified our assay to also test for quality of enrofloxacin (enro), a fluoroquinolone similar in structure to cipro which is used extensively in veterinary medicine. In animals, enro is metabolized to its active metabolite, cipro, and is therefore a driver of human-relevant cipro resistance.22 In this study, we evaluate this novel assay and compare to the gold standard, HPLC. These assays can be adapted to microfluidic platforms capable of quantifying fluorescence in a robust, automated, and portable system for medicine quality testing.23,24
MATERIALS AND METHODS
Assay design
In weakly acidic media, metal ions and surfactant quench the autofluorescence of cipro antibiotics, via a mechanism described elsewhere.25 As shown by Wang et al., palladium(II) (metal ion) and sodium dodecyl benzene sulfonate (surfactant) quench the autofluorescence of fluoroquinolones by formation of a ternary complex. Based on this, the authors established an assay to quantify palladium(II) in solution.
In the assay described here, cipro is dissolved in deionized water and mixed with a ‘probe’ solution containing the quenching agents— in our case, palladium(II) (metal ion) and methyl cellulose (surfactant). A detailed list of components in both the tablet and probe solutions is shown in Table 1. After addition of the probe solution, a decrease in the autofluorescent signal of cipro is monitored. The cipro/probe solution mixture is used for quantification to ensure that signal is specific to cipro. If cipro autofluorescence was used to quantify alone, other molecules in the tablet might fluoresce similarly, contributing to an unspecific signal.
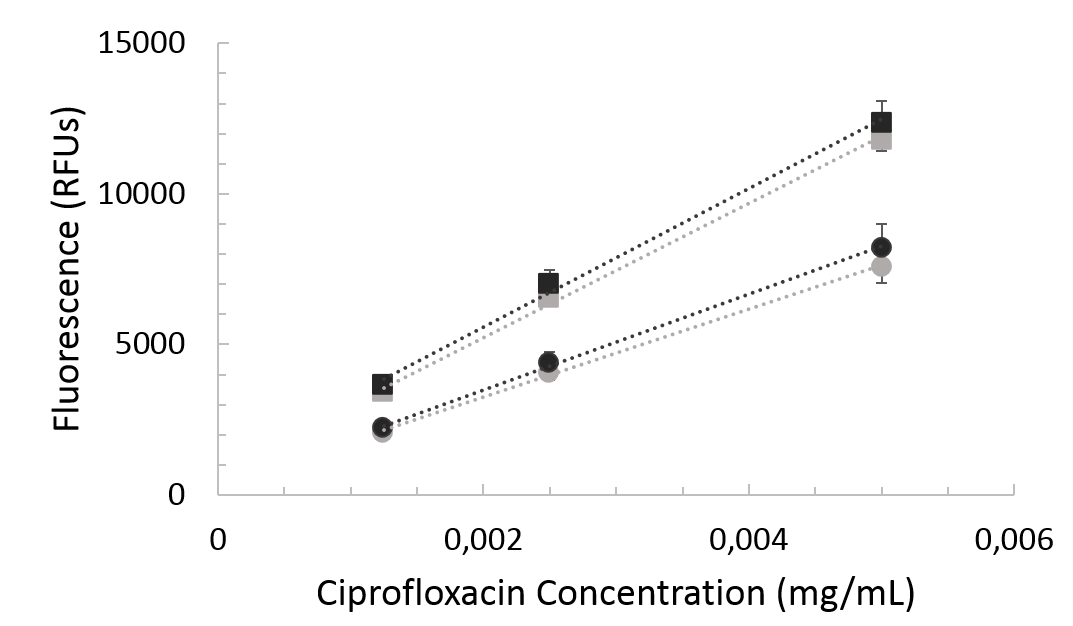
Cipro exhibits a linear fluorescence response in a range from 0.00125 mg/mL to 0.005mg/mL both before and after mixture with probe. This linear trend can be exploited to quantify samples with unknown amounts of cipro.
Cipro assay procedure
Powder
Cipro powder (Fisher Scientific) was dissolved in deionized water at 10 mg/mL (standard solution) and diluted to 0.005 mg/mL, 0.0025mg/mL and 0.00125 mg/mL. Autofluorescence of pure cipro powder (excitation 275, emission 450) was detected on the spectrophotometer (Molecular Devices SpectraMax M5 Microplate Reader). The assay was then performed by mixing probe solution, containing methyl cellulose, palladium chloride and acetate buffer at pH 5, with the cipro solutions at a 1:1 volume ratio. Autofluorescence was detected again on the spectrophotometer for 10 minutes, every 10 seconds. These experiments were conducted in a 96-well plate system.
Tablet
Cipro tablets (500mg) were dissolved in 50 mL of deionized water and filtered through a 0.22 mum cellulose acetate syringe filter (Abulo). The cipro solution was then diluted to the same concentrations explained above and the procedure for powder was followed exactly.
Cipro quantification
Samples of unknown concentration were compared to samples of known concentration via a linear fluorescence signal. The linear region (0.00125 to 0.005 mg/mL) of fluorescence from the powder samples was used to construct a line, and the tablet solutions were quantified using this line. Three tablet brands were tested: Brand A, Brand B, and Brand C. A scaling factor (ratio between the slope of powder and tablet standard curves) was used to scale the tablet samples to the powder samples, so that the powder line of best fit could be used for quantification.
HPLC protocol
HPLC was used as a gold-standard comparison to help assess the accuracy of our novel assay. A solution of 0.025M phosphoric acid (Fisher Scientific) was adjusted to pH 3.0 with triethylamine (Fisher Scientific). For the mobile phase, acetonitrile and the phosphoric acid solution were mixed 13:87.26 Cipro standard solutions were prepared in water at 5 concentrations between 0.005mg/mL and 0.1 mg/mL.
HPLC (Agilent 1100) was performed at 1.5mL/min at 30°C. A standard curve from powder samples was used to quantify tablet samples.
Cipro excipient testing
Cipro powder samples at 0.0025mg/mL were spiked with 5, 10, 25, and 50% excipient (inactive add-ins) by weight. Then, samples were filtered through a 0.22 mum cellulose acetate syringe filter and the assay was performed as described above. The normalized fluorescence was calculated by dividing the fluorescence of the cipro solution with excipient to the fluorescence of a control sample containing just cipro powder.
Enro assay procedure
Powder
Enro powder (Sigma) was dissolved in acetate buffer (pH 5) at 10 mg/mL (standard solution) and diluted to 0.005 mg/mL, 0.0025mg/mL and 0.00125 mg/mL. From this point, the cipro assay procedure was followed.
Tablet
Enro tablets (15, 50, and 150 mg) were dissolved in 50 mL of acetate buffer (pH 5) and filtered through a 0.22 mum cellulose acetate syringe filter (Abulo). The enro solutions were then diluted to the same concentrations explained above and the procedure for powder was followed exactly.
Guanine assay procedure
Guanine (Sigma) was dissolved in deionized water at 10 mg/mL (standard solution) and diluted to 0.005 mg/mL, 0.0025mg/mL and 0.00125 mg/mL. Autofluorescence (excitation 275, emission 450) was detected on the spectrophotometer (Molecular Devices SpectraMax M5 Microplate Reader). The assay was then performed by mixing probe solution, containing methyl cellulose, palladium chloride and acetate buffer at pH 5, with the guanine solutions at a 1:1 volume ratio. Autofluorescence was detected again on the spectrophotometer for 10 minutes, every 10 seconds. These experiments were conducted in a 96-well plate system.
RESULTS
Cipro autofluorescence is diminished in the presence of metal ions and surfactant by a mechanism explained elsewhere.25 This phenomenon can be exploited to quantify the amount of cipro in solution by comparing fluorescence values between samples of known and unknown concentrations.
Cipro powder is linearly fluorescent in the range between 0.00125 mg/mL and 0.005 mg/mL cipro. With the addition of probe, this linear signal continues but with quenched fluorescence, shown in Figure 1. When compared to cipro tablets dissolved at the same concentrations, cipro powder shows comparable fluorescence.

For quantification, a standard powder solution was prepared and diluted as described above. A tablet solution was filtered and diluted to various concentrations, also described above. The probe solution was added to both the powder and tablet samples and fluorescence was monitored. The linear region of fluorescence from the powder samples was used to construct a line of best fit, and the tablet solutions were quantified using this line. For Brand A, Brand B, and Brand C, we used a scaling factor of 0.70, 0.82, and 0.86, respectively. This was used to scale the tablet samples up to the powder samples so that the powder line of best fit could be used. The difference in fluorescent signal between powder and tablet was likely due to excipients in the tablet. But, because tablet formulations are proprietary, it is hard to identify and test the excipients specifically in these three tablet types that could be interfering in the assay and causing the need for a scaling factor.
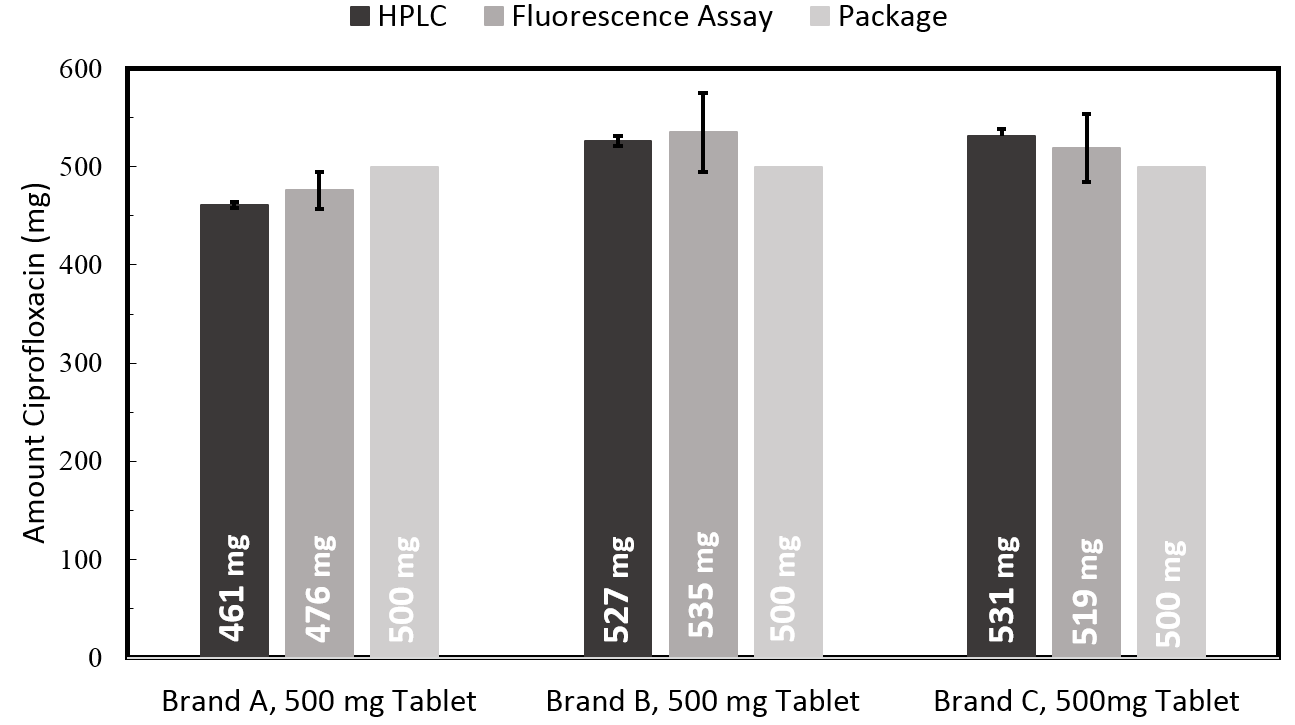
The three tablet types tested, as shown in Figure 2, showed an average error of 2.4% compared to HPLC, the gold-standard for tablet testing. The 500 mg Brand A tablet quantified at 482 mg using the fluorescence assay and 460 mg using HPLC. The 500 mg Brand B tablet quantified at 503 mg using the fluorescence assay and 525 mg using HPLC. The Brand C tablet quantified at 519 mg using the fluorescence assay and 531 mg using HPLC. Therefore, for the Brand A tablet, the error compared to HPLC was 3.3% while for Brand B it was 1.6% and Brand C it was 2.2%. HPLC was used as a gold-standard comparison for validation of the assay demonstrated here. Future use of this assay does not rely on HPLC testing.

To this end, we conducted specificity testing with the most commonly published excipients found in cipro formulations.27,28 We tested the effects of added cellulose, hypromellose, cornstarch, povidone k30, and magnesium stearate, using the procedure outlined above. As shown in Figure 3, none of these excipients greatly affect the cipro fluorescent signal, even in the presence of up to 50% excipient.

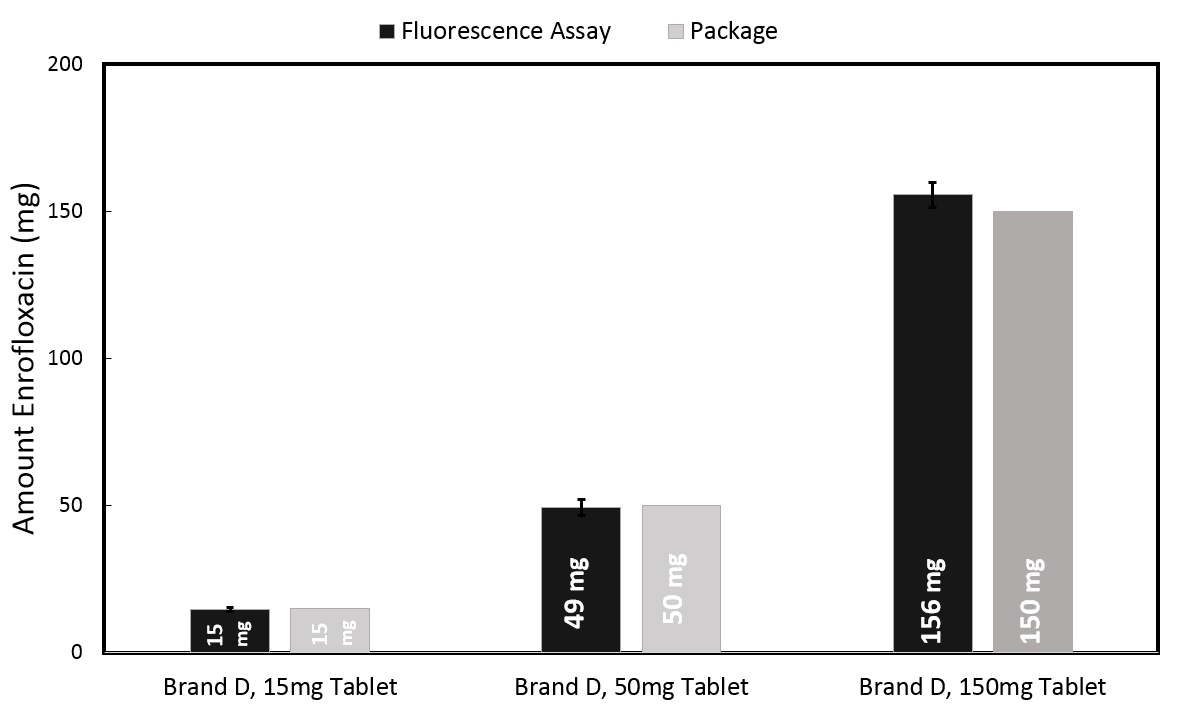
Enro, another fluoroquinolone similar in structure to cipro, is used extensively in veterinary medicine. We adapted our assay to quantify enro by changing the solvent for dissolving the tablet. Because enro is not water soluble, we instead used acetate buffer for dissolution. Then, following the assay procedure described above, we quantified 3 different dosage forms of veterinary enrofloxacin Brand D with an average error of 4.5% measured against package indication. 9 samples from each of the 15 mg and 50 mg tablets were quantified, while 6 samples from 150 mg tablets were quantified, shown in Figure 4. The 15 mg Brand D tablet quantified using the fluorescence assay as 15 mg, while the 50 mg and 150 mg tablets quantified at 49mg and 156 mg respectively.

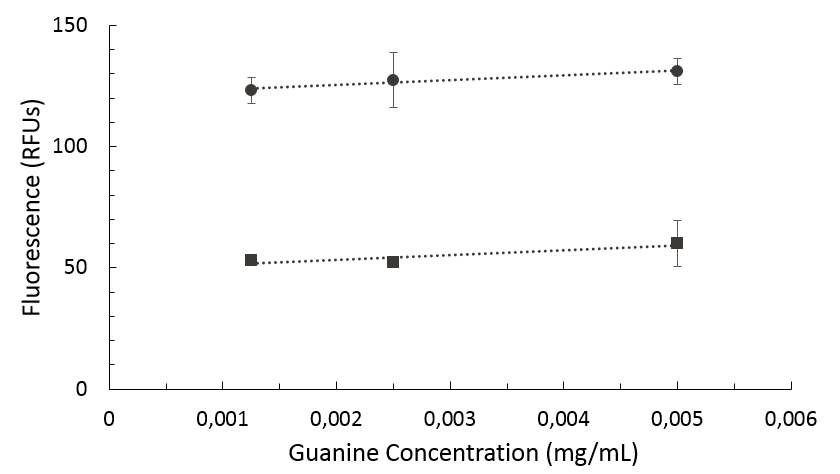
To ensure our assay was specific to fluoroquinolone drugs and would not detect other molecules with similar absorption and emission spectra, we tested this assay using guanine instead of cipro. Guanine, like cipro, shows an absorption peak at 275 nm and a corresponding emission peak at 450 nm. As shown in Figure 5, the fluorescence of guanine increases upon addition of probe: this is opposite the cipro quenching. Therefore, the quenching trend can be used to discriminate fluoroquinolones from other similarly absorbing and fluorescing molecules.

DISCUSSION
In this study, we demonstrate the use of a quantitative assay for cipro formulations. The widespread availability and use of substandard and counterfeit cipro has been linked to the increased risk of antimicrobial resistance, specifically in low-resource settings where there is a lack of regulatory policies governing appropriate manufacturing and quality assurance. The current methods used to assess the quality of cipro are prohibitively expensive for applications in low-resource settings (eg, HPLC) or do not provide quantitative data (eg, MiniLab). Additionally, many newer lab-based assays that have been developed still require extensive sample preparation, utilize dangerous reagents, and rely on expensive equipment and tools. Therefore, there are a lack of tests that can be easily translated to the field and assess quality of cipro in a quantitative manner.
To fill this gap, we have developed an assay to test for the amount of cipro in pharmaceutical formulations. We validated our assay by testing with three brands of cipro, showing an average of 2.4% error from the HPLC gold standard. Though showing great alignment with HPLC, the assay demonstrated here functions independently of HPLC - a quality imperative for field testing of pharmaceutical formulations. Additionally, we showed that our assay will not be affected by many of the common excipients in cipro formulations, specifically cellulose, hypromellose, cornstarch, povidone k30, and magnesium stearate. That being said, additional excipient testing would be useful to identify excipients in tablets that do cause a change in assay fluorescence. This could help to identify which tablet types will and will not need scaling factors for quantification.
We also extended this assay to quantify enro formulations in 3 common dosages with an average error of 4.5% measured against the package indication. With further development efforts, this assay could be adapted to other fluoroquinolones, such as norfloxacin and pefloxacin, as well. We ensured the specificity of our assay for fluoroquinolones by conducting cross reactivity tests with guanine, a molecule that absorbs and fluoresces similarly to cipro. Although this assay can readily assess the quality of cipro or enro from different formulations, it cannot discriminate between different fluoroquinolones if the identity is not known. Therefore, it would be necessary to know which fluoroquinolone is in the tablet being assessed. Additionally, we did not test this assay with substandard or counterfeit medications, as none were readily available to us. In future studies, we could do a more thorough collection and testing of ciprofloxacin tablets from around the world.
Despite this challenge, these assays show great promise in assessing the quality of cipro and enro formulations in the field, as they can be adapted to portable microfluidic platforms capable of assessing drug quality.23,24 At this point, these assays have been demonstrated as a proof-of-concept, but further development is needed to fully translate these assays to the previously mentioned microfluidic platforms. These assays can also be used to help strengthen the evidence linking poor quality medicines and AMR by surveying poor quality ciprofloxacin in the field. With these quantitative assays in hand, substandard and counterfeit cipro formulations can be identified and removed from circulation, thereby increasing the quality of medicines while decreasing poor patient outcomes and the acceleration of resistance.
CONCLUSION
This study demonstrates a quantitative fluorescence assay for cipro that can be incorporated at the point-of-care through previously developed microfluidic technologies capable of assessing drug quality.23,24 Cipro tablets of three different brands were quantified with an average error of 2.4%. The signal was not affected by the addition of 5 common cipro tablet excipients. Additionally, this assay was extended to quantify enro tablets of 3 concentrations with an average error of 4.5%.
This assay can be used to assess the quality of cipro tablets in the field and identify substandard tablets, potentially helping to remove those tablets from circulation and decrease acceleration of AMR to cipro.
Acknowledgements
We thank members of our research groups for input on the manuscript and insightful discussions.
Funding
This work was made possible by a grant from Saving Lives at Birth Consortium (AID-OAA-F-15-00029). Additionally, this research and program was supported in part by a grant to Prof. Zaman at Boston University from the Howard Hughes Medical Institute Science Education Program.
Competing interests
The authors complete the Unified Competing Interest from at http://www.icmje.org/coi_disclosure.pdf (available upon request from the corresponding author), and declare no conflicts of interest.
Correspondence to:
M.H. Zaman, Ph.D
Department of Biomedical Engineering
Boston University
44 Cummington Mall
Boston, Massachusetts, 02215
USA
[email protected]